3

In R you can add the mean to a boxplot like this:

set.seed(7)
values <- runif(100, 0, 1)
boxplot(values)
points(mean(values), col = 'red')

I would like to do the same in Julia with StatsPlots. Here is the code:

using StatsPlots
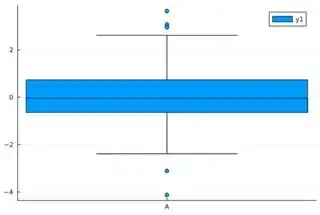
boxplot(repeat(['A'],outer=100),randn(300))

Output:

enter image description here

I am not sure how to add a single point (mean) to the boxplot. Is there a similar function like points? So I was wondering if anyone knows how to add the mean to a boxplot in Julia like above?
Quinten
  • 35,235
  • 5
  • 20
  • 53

2 Answers2

3

Adding context to the tip to use scatter!. The difference between scatter and scatter! already has a good explanation here.

julia> using StatsPlots
julia> using Statistics
julia> using Random

julia> Random.seed!(42)
TaskLocalRNG()

julia> val = randn(300);

julia> boxplot(repeat(['A'], outer=100), val, label = "boxplot")

julia> scatter!(['A'], [mean(val)], label = "mean")

boxplot combined with scatter point

Andre Wildberg
  • 12,344
  • 3
  • 12
  • 29
1

If you want a "point" at the mean, you can use a scatter! with the means on top of the boxplots.

Henri.D
  • 145
  • 9