If you have a statically allocated array, the Visual Studio debugger can easily display all of the array elements. However, if you have an array allocated dynamically and pointed to by a pointer, it will only display the first element of the array when you click the + to expand it. Is there an easy way to tell the debugger, show me this data as an array of type Foo and size X?
9 Answers
Yes, simple. say you have
char *a = new char[10];
writing in the debugger:
a,10
would show you the content as if it were an array.
- 15,207
- 15
- 92
- 123
- 76,898
- 55
- 205
- 325
-
12That's a great trick, but if your pointer points to an array of structures, I've found that the individual elements expanded with "a,10" in the watch window aren't themselves expandable. Meaning you can't dig into the 3rd element of the array using this method. Is that something that can be overcome? – SirPentor May 11 '12 at 18:20
-
@SirPentor I have the same issue. Have you found a solution? – a06e Aug 22 '12 at 19:43
-
@becko--negatory. It's frustrating. – SirPentor Aug 23 '12 at 01:51
-
wow, its useless for structures, you can just see the names of the vars, not values – Icebone1000 Feb 16 '14 at 16:41
-
2For beginners: If you select "a" variable, right click and add to watch list (inspect), if you open de debugger view in the list of watched values (I can't find the name of the window right now), you can double click "a" and rename it "a,X" where X is the number of items. You'll see now all the values. – Darkgaze May 19 '17 at 16:02
-
1Does anyone know how to use the same feature in Visual Studio Code IDE for C++. – kapilgm Nov 25 '19 at 01:35
-
@kapligm `*a@10` worked for me in the CPP IDE with gdb debugger. I had an object array, for a primitive array you maybe need to remove the asterisk. – Mark Jeronimus Mar 13 '22 at 11:37
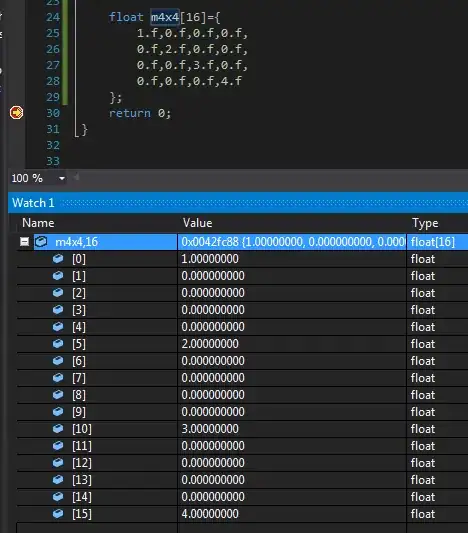
There are two methods to view data in an array m4x4:
float m4x4[16]={
    1.f,0.f,0.f,0.f,
    0.f,2.f,0.f,0.f,
    0.f,0.f,3.f,0.f,
    0.f,0.f,0.f,4.f
};
One way is with a Watch window (Debug/Windows/Watch). Add watch =
m4x4,16
This displays data in a list:

Another way is with a Memory window (Debug/Windows/Memory). Specify a memory start address =
m4x4
This displays data in a table, which is better for two and three dimensional matrices:

Right-click on the Memory window to determine how the binary data is visualized. Choices are limited to integers, floats and some text encodings.
- 9,989
- 2
- 37
- 33
-
-
-
1wups, forgot, thank you ! I've been spending a lot of time recently on a site where appreciation is mostly indicated by commenting. – orion elenzil Jan 11 '22 at 21:56
In a watch window, add a comma after the name of the array, and the amount of items you want to be displayed.
- 5,578
- 3
- 30
- 37
a revisit:
let's assume you have a below pointer:
double ** a; // assume 5*10
then you can write below in Visual Studio debug watch:
(double(*)[10]) a[0],5
which will cast it into an array like below, and you can view all contents in one go.
double[5][10] a;
- 229
- 3
- 14
Yet another way to do this is specified here in MSDN.
In short, you can display a character array as several types of string. If you've got an array declared as:
char *a = new char[10];
You could print it as a unicode string in the watch window with the following:
a,su
See the tables on the MSDN page for all of the different conversions possible since there are quite a few. Many different string variants, variants to print individual items in the array, etc.
- 622
- 1
- 8
- 21
-
1From the MSDN link you gave -- `a,[10]` allows you to see individual elements so that they themselves are expandable, even if you have a CArray of complex data types. – LThode May 05 '15 at 14:10
You can find a list of many things you can do with variables in the watch window in this gem in the docs: https://msdn.microsoft.com/en-us/library/75w45ekt.aspx
For a variable a, there are the things already mentioned in other answers like
a,10
a,su
but there's a whole lot of other specifiers for format and size, like:
a,en (shows an enum value by name instead of the number)
a,mb (to show 1 line of 'memory' view right there in the watch window)
- 894
- 1
- 11
- 25
For MFC arrays (CArray, CStringArray, ...) following the next link in its Tip #4
http://www.codeproject.com/Articles/469416/10-More-Visual-Studio-Debugging-Tips-for-Native-De
For example for "CArray pArray", add in the Watch windows
pArray.m_pData,5
to see the first 5 elements .
If pArray is a two dimensional CArray you can look at any of the elements of the second dimension using the next syntax:
pArray.m_pData[x].m_pData,y
- 766
- 6
- 9
I haven't found a way to use this with a multidimensional array. But you can at least (if you know the index of your desired entry) add a watch to a specific value. Simply use the index-operator.
For an Array named current, which has an Array named Attribs inside, which has an Array named Attrib inside, it should look like this if you like to have to position 26:
((*((*current).Attribs)).Attrib)[26]
You can also use an offset
((*((*current).Attribs)).Attrib)+25
will show ne "next" 25 elements. (I'm using VS2008, this shows only 25 elements maximum).
- 135
- 3
- 11