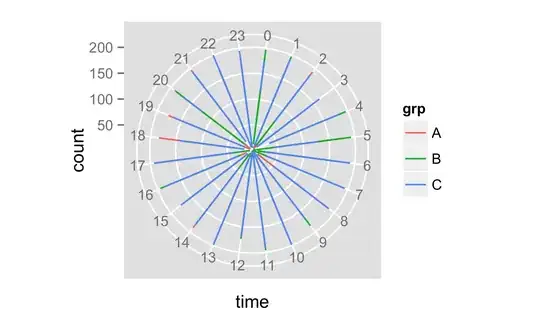
I have numerous 2D lines (x1,y1;x2,y2) and a bunch of lines crossed each other in a specific area of the map. I have plotted as below, but it may not be easy to interpret.
 Is it possible to use these 2D lines in the form of heatmap, and represent the crossing density in each cell (like this flights path).
In other ways, each 2D line has a Z value, so we may use it as a color bar for that heatmap.
I have seen multiple heatmap plots using scatter data points but could not find any way for 2D lines. Example
Any suggestions will be appreciated.
