Possible Duplicate:
Fitting a density curve to a histogram in R
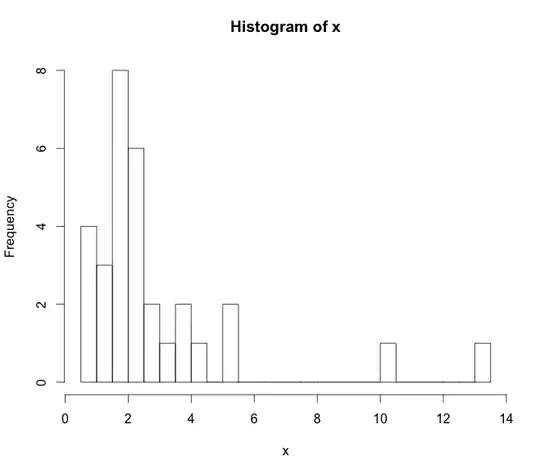
I'm trying to add a best fit normal over a histogram in R. Right now, I have the following:
x<-table[table$position==1,]$rt
hist(x,breaks=length(x))
And now I'd like to plot a normal curve over this plot which allows for skew and for kurtosis. How can I do this? This is what my curve looks like: