I have a dataset that has four columns, and I'm trying to create a multi-panel set of bar graphs separated by the last three columns. This is what the dataset looks like:
| name | title1 | title2 | title3 |
| x    | 10     | 10     | 10     |
| y    | 10     | 10     | 10     |
I know can create individual bar plots and they'll be just as functional side by side, but I want to be able to compare all three at the same time. Is it possible to do that?
Code for separate bar plots
df %>%
  ggplot(aes(x = name, y = title1)) +
  geom_bar(stat = "identity")

df %>%
  ggplot(aes(x = name, y = title2)) +
  geom_bar(stat = "identity")

df %>%
  ggplot(aes(x = name, y = title3)) +
  geom_bar(stat = "identity")
Code I tried:
df %>%
ggplot(aes(x = name, y = title1 + title2 + title3)) +
geom_bar(stat = "identity") +
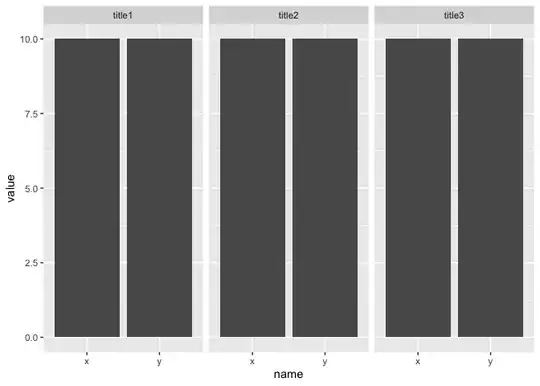
facet_wrap(~title1 + title2 + title3, ncol = 3)
Which gets me something like this: