0

The example code here for rgl does almost what I want. However my (x,y) are not in a rectangle but in a triangle that is half of the rectangle (x=0..1, y=0..1 and z is missing if x+y>1).

My input dataset is in the following format:
x1 x2 x3 x4 x5 x6 z

and I would like to visualize (x4, x5, z) and (x2, x3, x6), etc. Any help is appreciated how to do this in R, I am beginner.

Can export the final plot into PDF, EPS or SVG?

UPDATE: OK, I see I can export to EPS.

UPDATE 2: Thanks to Carl I almost got what I want. 3D surface over a triangle
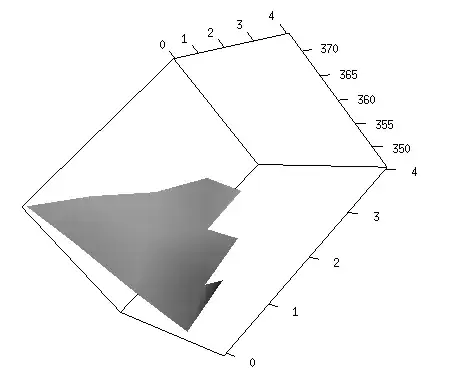
The only problem is that one of the edges of the surface is saw-toothed. Between the teeth, where x+y<=4 the surface should be kept so the saw-toothed edge becomes like the other edges. How can I do this?

The R code is below, the input data is here

library(rgl)
mat = matrix(scan("bpexamp.out"),ncol=9,byrow=T)
N <- 4
x <- c(0:N)
y <- c(0:N)
z <- mat[,9]
zlim <- range(y)
zlen <- zlim[2] - zlim[1] + 1
colorlut <- terrain.colors(zlen,alpha=0) # height color lookup table
col <- colorlut[ z-zlim[1]+1 ] # assign colors to heights for each point
open3d()
aspect3d(1,1,0.1)
surface3d(x, y, z, col)
axes3d()
Community
  • 1
  • 1
Ali
  • 56,466
  • 29
  • 168
  • 265
  • `rgl.triangles`? You can get screenshots with `rgl.snapshot`, but only in png format. – James Oct 03 '11 at 10:33
  • 1
    Please provide a sample dataset. If z is missing for some combinations of Xj,Xk, do you want to set z to zero, or do you want NOT to plot in that region, or do you need to interpolate? And if all your Xj, Xk are in a triangle, why not just plot that triangular region? Some clarification would help. – Carl Witthoft Oct 03 '11 at 11:51
  • @James Yes, triangles are a possibility, I did not find them, thanks for pointing that out. – Ali Oct 03 '11 at 15:49
  • @CarlWitthoft The z is ALWAYS missing if x+y > 1 and I do not want to plot anything instead of the missing values. Could you please expand on plotting the triangular region? – Ali Oct 03 '11 at 15:50
  • Just set z <- NA in the 'missing' regions. NA values will not be plotted at all. – Carl Witthoft Oct 03 '11 at 16:42
  • @CarlWitthoft Thanks, it almost works. Please check my update. – Ali Oct 03 '11 at 20:27

1 Answers1

1

This is a comment - but I don't know howto put an image into a comment, so formatted as an answer. I ran yr stuff and got this chart: I ran yr stuff and got this chart: enter image description here

So, what is missing or inaccurate here? We can probably 'fix' it for you...

Carl Witthoft
  • 20,573
  • 9
  • 43
  • 73
  • Thanks :) I would like to have the missing small triangles for the following (x,y) coordinates: (0,4)-(1,3)-(0,3); (1,3)-(2,2)-(1,2); (2,2)-(3,1)-(2,1), (3,1)-(4,0)-(3,0). If you add these triangles then the saw-toothed edge becomes a nice curve. Keep in mind that in my application x and y runs from 0 to 1000 so I have to do that automatically. In this example x and y runs from 0 to 4 so I could have added the missing stuff by hand. – Ali Oct 04 '11 at 07:51
  • I am still interested in getting an answer :) Sometimes the surface is interesting near the missing edge. – Ali Oct 09 '11 at 16:43