1

I have a problem with gradient fill of geom_polygon(). I created a triangle, and I need to fill it with three colors. Each color should start in each angle of a triangle, and then they mix in the middle as gradient. I have this code below, but the triangle is fully filled with black. I also need to insert text labels next to each angle.

triangle_data <- data.frame(
  x = c(0, 1, 0.5),
  y = c(0, 0, sqrt(3)/2),
  value = c(0, 0.5, 1)  
)

# Calculate the equilateral triangle vertices
side_length <- 1  # Length of each side of the equilateral triangle
height <- side_length * sqrt(3) / 2  # Height of the equilateral triangle
triangle_data$x <- c(0, side_length, side_length/2)
triangle_data$y <- c(0, 0, height)


triangle_plot <- ggplot() +
  geom_polygon(data = triangle_data, aes(x = x, y = y, color = value)) + 
  scale_fill_gradient2(position="bottom" , low = "blue", mid = scales::muted("green"), high = "red") +
  theme_void()  # Remove axis and background

triangle_plot

There is an example of the result that I want to obtain. The only difference that the triangle should be on the white background + text labels in each angle.

enter image description here

I tried the code that I posted. But the result looks like that.

enter image description here

zx8754
  • 52,746
  • 12
  • 114
  • 209
  • 2
    I think you need "fill" not "color" – zx8754 May 31 '23 at 08:37
  • 1
    I replaced "color = value" by "fill=value". But now the triangle is fully dark green now. Not gradient – user19818282 May 31 '23 at 08:48
  • This may help even though it is a different gradient and not a ggplot solution (but it would work with ggplot) https://stackoverflow.com/questions/11777124/three-way-color-gradient-fill-in-r – Yacine Hajji May 31 '23 at 09:04
  • Thank you for your comment. Indeed, I already checked it. But because it's not ggplot, I do not understand how to modify it for my need. – user19818282 May 31 '23 at 09:09

1 Answers1

0

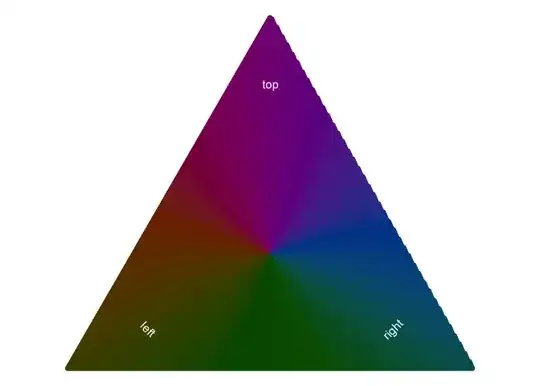
This ggplot approach may not be exactly what you want, but see if it helps. It borrows calculations from three-way color gradient fill in r and uses geom_point() and scale_colour_identity() rather than geom_polygon() and scale_*_gradient2().

Lots of data-points are generated to enable the gradient.

library(tidyverse)

res <- 300 # resolution

df <- map(1:(res * sqrt(3) / 2) / res, \(y){
  map((y * res / sqrt(3)):(res - y * res / sqrt(3)) / res, \(x){
    tibble(
      gr = y,
      rd = abs(sqrt(3) * x - y) / sqrt(3 + 1),
      bl = abs(-sqrt(3) * x - y + sqrt(3)) / sqrt(3 + 1),
      x = x,
      y = y
    )
  })
}) |>
  list_flatten() |>
  list_rbind() |> 
  mutate(colour = rgb(1 - rd, 1 - gr, 1 - bl) |> scales::muted())

# With colour identity
df |>
  ggplot(aes(x, y, colour = colour)) +
  geom_point() +
  annotate("text", x = 0.5, y = 0.7, label = "top", colour = "white") +
  annotate("text", x = 0.2, y = 0.1, label = "left", angle = -45, colour = "white") +
  annotate("text", x = 0.8, y = 0.1, label = "right", angle = 45, colour = "white") +
  scale_colour_identity() +
  coord_equal() +
  theme_void()

Created on 2023-05-31 with reprex v2.0.2

Carl
  • 4,232
  • 2
  • 12
  • 24
  • Thank you for your reply! I just have a question. What should I change in the code if I want to have other colors in corners of the triangle? Let's say instead of blue, red and green I need to use pink, white and blue. I guess this part of the code needs to be modified: mutate(colour = rgb(1 - rd, 1 - gr, 1 - bl) – user19818282 May 31 '23 at 15:56