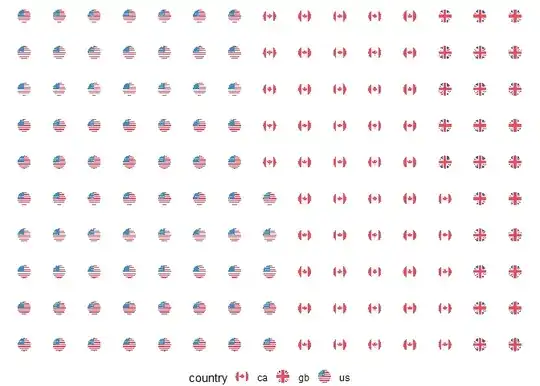
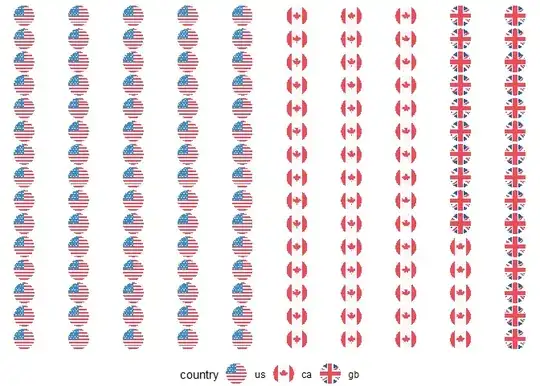
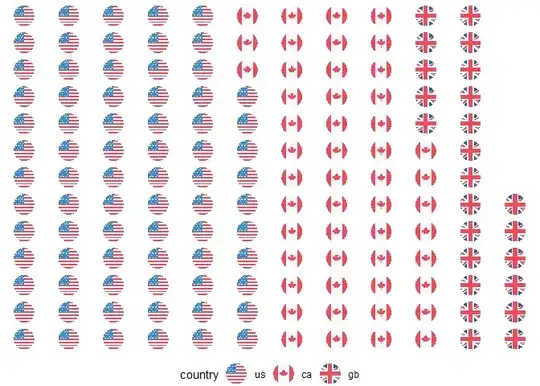
I would like to create a waffle chart and use country flags in place of squares. Here is my current attempt using ggwaffle:
library(ggplot2)
library(emojifont)
library(ggwaffle)

iris2 <- iris
iris2$Species <- c("", "", "")

waffle_data <- waffle_iron(iris2, aes_d(group = Species))
waffle_data$label = fontawesome('fa-flag')

ggplot(waffle_data, aes(x, y, colour = group)) +
  geom_text(aes(label=label), family='fontawesome-webfont', size=7) +
  coord_equal() +
  scale_colour_waffle() +
  theme_waffle()

Created on 2023-06-18 with reprex v2.0.2
Is it possible at all with ggwaffle? I was also trying to play with ggflags but I don't see how to make these two compatible because ggflags replace points in a scatter plot.
I am also aware that Windows does not ship with country flag unicode emojis for political reasons, so base unicode wouldn't work (as in one of my previous attempts using the waffle package). So it would need to be a font that includes country flags or images thereof. Thanks for any help.