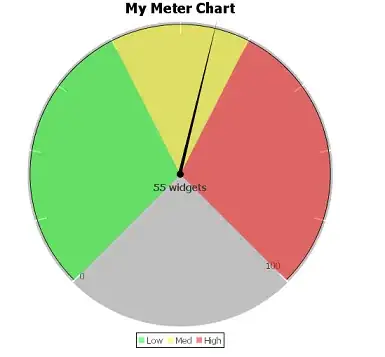
I am using the following code:
import numpy as np
from matplotlib import cm
import matplotlib as mpl

fig = plt.figure()

display_axes = fig.add_axes([0.1,0.1,0.8,0.8], projection='polar')
display_axes._direction = 2*np.pi ## This is a nasty hack - using the hidden field to
                                  ## multiply the values such that 1 become 2*pi
                                  ## this field is supposed to take values 1 or -1 only!!

norm = mpl.colors.Normalize(0.0, 2*np.pi)

# Plot the colorbar onto the polar axis
# note - use orientation horizontal so that the gradient goes around
# the wheel rather than centre out
quant_steps = 2056
cb = mpl.colorbar.ColorbarBase(display_axes, cmap=cm.get_cmap('hsv',quant_steps),
                                   norm=norm,
                                   orientation='horizontal')

# aesthetics - get rid of border and axis labels
cb.outline.set_visible(False)
display_axes.set_axis_off()
plt.show() # Replace with plt.savefig if you want to save a file
from Plot a (polar) color wheel based on a colormap using Python/Matplotlib here.
I need to plot black points on this color wheel. How could I do this? Is it possible to overlay a scatter plot on top of this color wheel?
