3

In this report https://gtmetrix.com/reports/www.datanumen.com/tFIOxtvx/, there are long gap between the requests, as below:

enter image description here

In https://gtmetrix.com/blog/how-to-analyze-a-waterfall-chart/#long-empty-gaps and Gaps in FireBug waterfall chart, it is explained as the execution/loading of the JS/CSS resources. However, how to know which JS/CSS resource cause the gap?

alancc
  • 487
  • 2
  • 24
  • 68

1 Answers1

3

On a Chrome or Firefox browser press F12 to access the developer tools. Go to the network tab, clear any recording active with the cancel button, then press the record button , refresh the page and stop the recording once it has loaded. You should now see your waterfall. You can now navigate to the performance tab to see what operations were taking place.

Looking at the waterfall of the site under developer tools the wait occurs around the 80ms mark and resumes at around 93ms (on this particular page load)

Developer tools waterfall

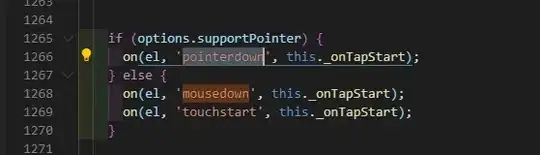
In the performace tab we can see that is around the same time the browser loads additional JS content. So yes, it is js related and a blocking operation caused by the elements being loaded and repainting the screen (Lazy load, theme, and something I suspect being a library).

Performance tab Zoom and enhance

Here are the recources

A B C

mpmcintyre
  • 614
  • 5
  • 16
  • How to see a wait starting from about 80ms to 93ms? I try to see your 1st image, there is a very small bar at around 80ms, no span from 80ms to 93ms. – alancc Aug 10 '23 at 11:07
  • I added the image below it, you can scroll to soom in on that area in the performance tab. Open devtools and try it in order to be able to zoom in on that area. – mpmcintyre Aug 10 '23 at 11:17
  • @alancc did this answer your question? – mpmcintyre Aug 10 '23 at 14:28
  • How to perform the similar analysis in GTMetrix's Waterfall? With Chrome, I cannot see long gap, also I cannot make tests from different locations. – alancc Aug 11 '23 at 05:51
  • I do not see a way to do this in depth analysis in GTMetrix. You can only try find correlations between what is loading long and what GTMetrix says. I would suggest throttling your device when using DevTools. It might be the case that the gap is caused by an outbound request or poor performance. To do so toggle the device toolbar (next to the topmost left icon in devtools) and apply throttling – mpmcintyre Aug 11 '23 at 08:52