23

When testing performance of various web pages on my web application I noticed that there are some gaps in net tab (waterfall chart) in firebug. In some cases these may take up half of the time for the whole request.

What usually causes these gaps and how can they be removed?

enter image description here

Eric P
  • 2,907
  • 2
  • 24
  • 33
  • 3
    Great question. I am a Web dev who was asked to make a page that was rendering slowly render faster. Devs love Firebug and they love the network tab because it shows "how long the individual components take." I saw a graph kind of like this for my page. I saw how long it took each file in the page to be sent - some were fast and some were slower. I wondered "What if the gaps are the browser processing the JS, CSS etc? What if the gaps are the delays I can control? What if *the voids are what we are really concerned about?*" – Andrew Koper Jan 09 '15 at 22:17

3 Answers3

15

Jan Odvarko who worked on Firebug explains it himself here:

http://www.softwareishard.com/blog/firebug/firebug-net-panel-timings/

He mentions the gaps in comment #18:

"These gaps represent a time when no requests happened, this can be e.g. due to a javascript execution on the page, which blocks page download or page rendering, CSS resolving, etc."

Smily
  • 151
  • 1
  • 3
14

The main reason this happens is for files that are loaded by scripts and CSS files.

  • For example: CSS, background images won't start loading until a small delay after the CSS file that links to them loads.

  • Many JS libraries also load images, CSS, and/or other files. These loads won't start until the calling JS is loaded, plus a small processing delay.

  • Libraries, or inline JS, may also fire off loads at the DOMContentLoaded event (the purple line) or the load event (red line).

  • Finally, obviously, JS can execute AJAX that fires after any manner of delays/intervals.

Brock Adams
  • 90,639
  • 22
  • 233
  • 295
1

The most obvious reason I can think of (other than a bug in Firebug) is that you've got the filter switched to only show a subset of requests. For example, you may only be showing Javascript files, etc.

Your screenshot doesn't include the filters or the filenames, so I can't tell that for sure, but that seems like the most obvious answer.

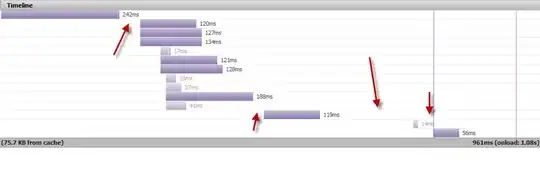
Immediately above the panel in your screenshot is a block of filters. Make sure you've got the "All" option selected. If you have anything else selected, then gaps are to be expected.

The other reason would be if you have some page elements being fetched separately from the initial load, eg via Ajax or deferred loading. These may be loaded very soon after the page has loaded, but not immediately, leading to gaps in your timeline.

Hope that helps.

Spudley
  • 166,037
  • 39
  • 233
  • 307