I'm trying to make a map based on zip codes in California, US.
Using the solution from my previous question (How to create a map using zip codes in R?), I obtained CA zip codes using:
library(tigris)
library(ggplot2)

zipcode <- zctas(year = 2000, state = "CA", cb = TRUE)
Then, I have my cleaned zip code file (named "ca") that has a column of zip codes and a column of count number, as integer.
I combined the two dataset using the following, zipcode goes first because that will save geometry.
zipcodes <- merge(zipcode, ca, by = "ZCTA", all.x = TRUE) %>%
  rename(COUNT = "Count")
Here's the code to plot:
ggplot() +
  geom_sf(data = zipcodes, aes(fill = COUNT)) +
  scale_fill_gradientn(colors = c("red", "cornsilk", "#f0d080"),
                       values = c(1, 14150, 28307, na.value = "gray")) + #28307 is the max count.
  theme_minimal()
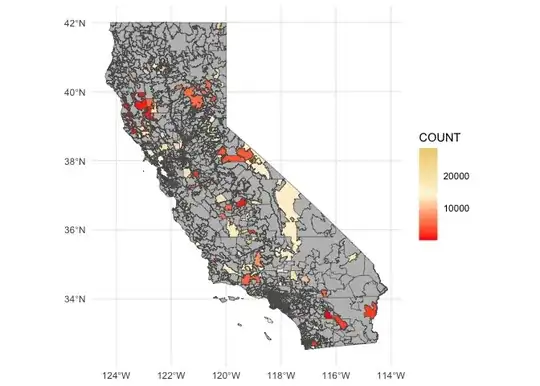
It's producing the following map, which doesn't seem to like my gradient code...

Some rows do have NA for COUNT because my dataset doesn't have a count for every zip, but I want to keep their geometry for the purpose of plotting a complete map.
When plotting, I also got the error message saying:
Warning messages:
1: In xy.coords(x, y, setLab = FALSE) : NAs introduced by coercion
2: In xy.coords(x, y, setLab = FALSE) : NAs introduced by coercion
3: In xy.coords(x, y, setLab = FALSE) : NAs introduced by coercion