-1

I have an array of points [[x1,y1],[x2,y2],[x3,y3]...] I am able to render the below Line chart using these points-enter image description here

But I want a smooth curve, something like this-enter image description here

Edit: I tried this solution, but it fails my requirement in some cases. For example, see the below chart rendered using this approach- enter image description here
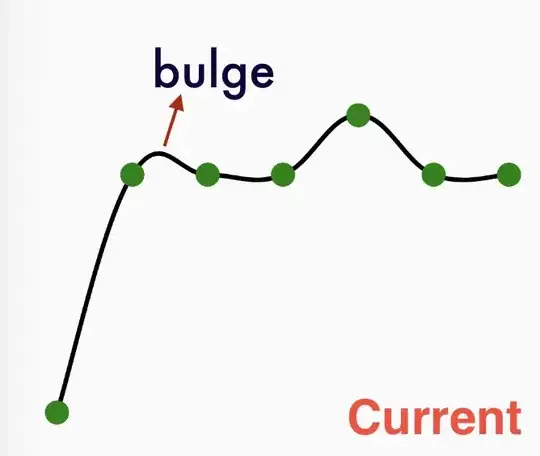
Is there a way to get the svg path of a smooth curve, that passes through all the points without going above or below them, or in other words- without making unnecessary bulges or depressions? In fact, For the same data set I want a curve like this- expected-curve
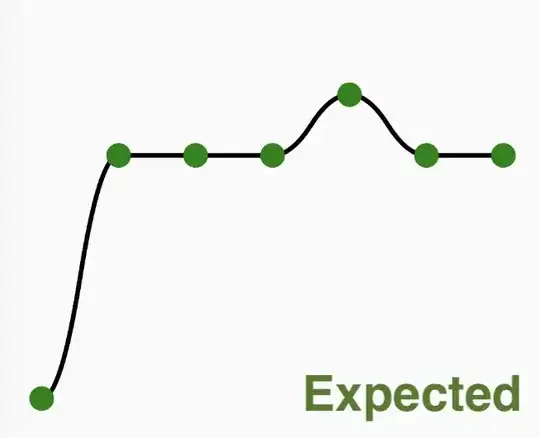
  • 1
    Please take a look at this answer: https://stackoverflow.com/questions/64933819/calculate-a-curve-that-goes-through-all-the-points/64934180#64934180 – enxaneta Aug 28 '23 at 17:42
  • Thanks @enxaneta This link provides a function that returns curved svg path from array of points. But in some cases, the curve does not meet my requirement. See [this screenshot](https://raw.githubusercontent.com/Abhinandan-Kushwaha/chart-images/main/screenshots/bulge.png). It has unnecessary bulge, where it should have been a straight line. – Abhinandan Kushwaha Aug 28 '23 at 19:03
  • 1
    Don't put additional details in comments, [put them in your post](/help/how-to-ask). Also the curve you're showing in that new image is pretty much what things _have_ to look like, unless you can come up with additional rules based on a sequence of neighbours, rather than just the direct neighbours. But on an SO note: SO is not for asking folks to supply you with code, it's for getting help fixing _your_ code, so what have you tried already? (and please put what you've tried already in your post, of course). – Mike 'Pomax' Kamermans Aug 28 '23 at 21:33
  • Thanks @Mike'Pomax'Kamermans I have updated my question. – Abhinandan Kushwaha Sep 01 '23 at 13:08
  • Thanks. The second point still stands though: that's what things _have_ to look like if you're using a spline interpolation, because the only direction you can go from the first point is towards the second point, and the only way to not have any bulge is if, at the second point, you abruptly change direction towards the third point, which isn't a curve, that's just a polygon. You're showing the exact data example where curve fitting is universally going to look weird. In fact, spline interpolation looks downright "nice" compared to regular polygonal interpolation, which will "wave". – Mike 'Pomax' Kamermans Sep 01 '23 at 17:09
  • So what is missing is a picture of what kind of curve you actually want to see going through those points, because that determines all the extra rules that you're currently not talking about that the curve fitting would have to adhere to. – Mike 'Pomax' Kamermans Sep 01 '23 at 17:12
  • @Mike'Pomax'Kamermans I undersood that my example is not a good one for curve fitting. I also admit that the bulge I have shown in my example is mathematically correct. But I need a chart which looks curved for *changing values* and straight for *constant values*. So I am changing my example. I have added the screenshots of the currently achieved curve and the curve that I actually need. – Abhinandan Kushwaha Sep 02 '23 at 01:07
  • So you need two _different_ curve fitting solutions for two _different_ use-cases? Then please rewrite your post to explain that (and include your actual use cases so people can tell whether what you think you need is what you actually need) and don't have an `"edit: ...", your post is not an answer that needs to be updated years after the fact because technologies changed, your post is going to stay the same question forever: just rewrite it so that it reads as a normal (but different from before) question. – Mike 'Pomax' Kamermans Sep 02 '23 at 16:03

0 Answers0