2

summarizing I have implemented a chart control as a simple Canvas with a Polyline on it. The next thing I need is to be able to zoom the chart.

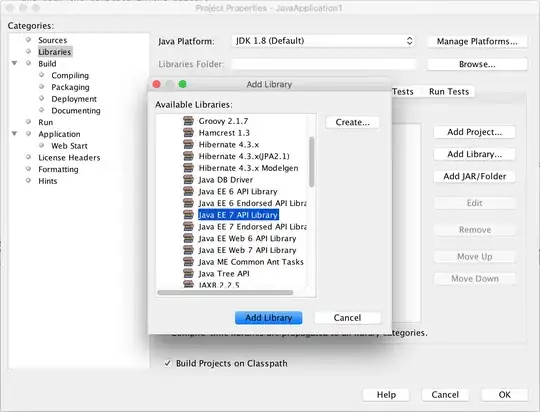
I would like to know how would you that (just the idea, no details needed). What I would like to do is to create somehow a bigger Canvas and paint the line bigger and just show a part of the Canvas to the user, and the he drags the Chart it will move the Canvas. Something like in the following picture. Do you think this is possible?

enter image description here

Ignacio Soler Garcia
  • 21,122
  • 31
  • 128
  • 207
  • One (other) way I did it was a separate control like in google maps using which one can zoom-in/out and also pan. To that control I bound my canvas's ScrollViewer and update the ScrollViewer's viewport's horizontal and vertical offset for panning and update the ScrollViewer.LayoutTransform with the updated ScaleTransform for zoom in-out. – Bhupendra Oct 24 '11 at 15:43
  • Thanks for pointing me that there is something called viewport. Looks like what I'm, after. I will check. Thanks. – Ignacio Soler Garcia Oct 24 '11 at 15:52
  • Just to be sure. What you did was the custom Canvas control, the custom viewport or both? – Ignacio Soler Garcia Oct 24 '11 at 16:42
  • I had custom canvas (derived from wpf Canvas) inside ScrollViewer, then working with ScrollViewer.ViewportHeight, ViewportWidth and scrolling methods – Bhupendra Oct 25 '11 at 07:32

2 Answers2

3

Kael Rowan from Microsoft Research built a ZoomableCanvas class that may do exactly what you want. You can also see all the posts he wrote about it. You can even try a running XBAP example if your browser supports it.

edallme
  • 949
  • 5
  • 8
1

We use the RenderTransform for this, create your zoom and pan matrix( or transform ) and apply that to your canvas. The nice thing is, that you can still have elements that can display behind or on top of the canvas with the identity transform or with another. For example for a grid or screen space elements like a minimap, which should always be visible. You might also want to look into this old question, which is somehow related.

Community
  • 1
  • 1
dowhilefor
  • 10,971
  • 3
  • 28
  • 45
  • Mmmmm, I thought on that but there are other things on the Chart, like cursors, the axis and so on and I don't want them bigger. Do you know what I mean? – Ignacio Soler Garcia Oct 24 '11 at 15:38
  • Yes and you have a couple of options about that. You could invert the RenderTransform on these Elements. Or you could add them on an element above/below the canvas with the render transform. Like i said, you could also apply different transforms on these elements, e.g. with panning but no zooming. We do the same for our pan/zoomable graph, of course we don't want the rubberband selection to grow with the zoom value. It works perfectly for us. – dowhilefor Oct 24 '11 at 15:49
  • Great idea, I will check for sure. Thanks! – Ignacio Soler Garcia Oct 24 '11 at 15:54