6

Has anyone tried creating Normal Distribution chart using FLOT?

If so, can you please put me in a right direction with some suggestions and links to tutorial?

Thanks.

developer
  • 718
  • 9
  • 28

1 Answers1

9

FLOT is simply a plotting engine. If you want to create a Bell Curve, you need to feed a probability density function a series of x values and plot the resulting points.

For instance I used the functions from here to create this:

enter image description here

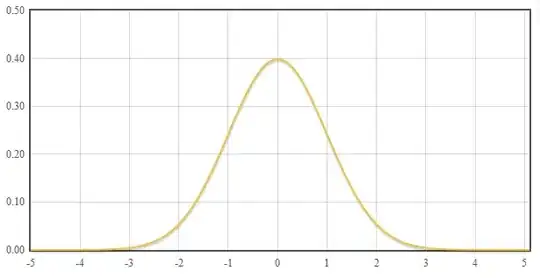
Here's the jsFiddle that shows my work.

Mark
  • 106,305
  • 20
  • 172
  • 230
  • @DanielQuinn, I hope my link here didn't cause his webserver too much grief! – Mark May 18 '12 at 16:27
  • Also available in the Wayback Machine Internet archive : https://web.archive.org/web/*/http://25yearsofprogramming.com/javascript/probability.htm – Laurent Jégou Nov 30 '13 at 09:49
  • Any idea how to shade a region between two lines on this bell curve (e.g. between -2 and 2)? – Garry Pettet Jun 29 '14 at 12:43
  • @Garry, if you want to fill under the curve, I'd create a second series that goes from -2 to 2 and set fill to `true`, if you want to fill the back ground from -2 to 2 use the markings option: https://github.com/flot/flot/blob/master/API.md#customizing-the-grid – Mark Jun 29 '14 at 12:46
  • 2
    [Here's another jsFiddle](http://jsfiddle.net/tE24t/290/) showing how you can highlight on the grid. – Momer Oct 27 '14 at 19:28