186

I'm trying to make a square plot (using imshow), i.e. aspect ratio of 1:1, but I can't. None of these work:

import matplotlib.pyplot as plt

ax = fig.add_subplot(111,aspect='equal')
ax = fig.add_subplot(111,aspect=1.0)
ax.set_aspect('equal')
plt.axes().set_aspect('equal')

It seems like the calls are just being ignored (a problem I often seem to have with matplotlib).

jtlz2
  • 7,700
  • 9
  • 64
  • 114

7 Answers7

123

A simple option using plt.gca() to get current axes and set aspect

plt.gca().set_aspect('equal')

in place of your last line

SKPS
  • 5,433
  • 5
  • 29
  • 63
Liz Deucker
  • 1,341
  • 1
  • 5
  • 3
111

Third times the charm. My guess is that this is a bug and Zhenya's answer suggests it's fixed in the latest version. I have version 0.99.1.1 and I've created the following solution:

import matplotlib.pyplot as plt
import numpy as np

def forceAspect(ax,aspect=1):
    im = ax.get_images()
    extent =  im[0].get_extent()
    ax.set_aspect(abs((extent[1]-extent[0])/(extent[3]-extent[2]))/aspect)

data = np.random.rand(10,20)

fig = plt.figure()
ax = fig.add_subplot(111)
ax.imshow(data)
ax.set_xlabel('xlabel')
ax.set_aspect(2)
fig.savefig('equal.png')
ax.set_aspect('auto')
fig.savefig('auto.png')
forceAspect(ax,aspect=1)
fig.savefig('force.png')

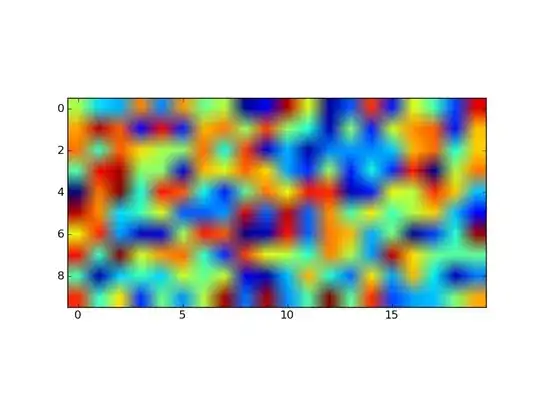
This is 'force.png': enter image description here

Below are my unsuccessful, yet hopefully informative attempts.

Second Answer:

My 'original answer' below is overkill, as it does something similar to axes.set_aspect(). I think you want to use axes.set_aspect('auto'). I don't understand why this is the case, but it produces a square image plot for me, for example this script:

import matplotlib.pyplot as plt
import numpy as np

data = np.random.rand(10,20)

fig = plt.figure()
ax = fig.add_subplot(111)
ax.imshow(data)
ax.set_aspect('equal')
fig.savefig('equal.png')
ax.set_aspect('auto')
fig.savefig('auto.png')

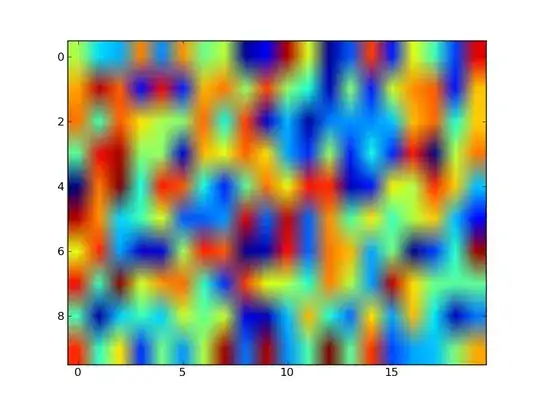
Produces an image plot with 'equal' aspect ratio: enter image description here and one with 'auto' aspect ratio: enter image description here

The code provided below in the 'original answer' provides a starting off point for an explicitly controlled aspect ratio, but it seems to be ignored once an imshow is called.

Original Answer:

Here's an example of a routine that will adjust the subplot parameters so that you get the desired aspect ratio:

import matplotlib.pyplot as plt

def adjustFigAspect(fig,aspect=1):
    '''
    Adjust the subplot parameters so that the figure has the correct
    aspect ratio.
    '''
    xsize,ysize = fig.get_size_inches()
    minsize = min(xsize,ysize)
    xlim = .4*minsize/xsize
    ylim = .4*minsize/ysize
    if aspect < 1:
        xlim *= aspect
    else:
        ylim /= aspect
    fig.subplots_adjust(left=.5-xlim,
                        right=.5+xlim,
                        bottom=.5-ylim,
                        top=.5+ylim)

fig = plt.figure()
adjustFigAspect(fig,aspect=.5)
ax = fig.add_subplot(111)
ax.plot(range(10),range(10))

fig.savefig('axAspect.png')

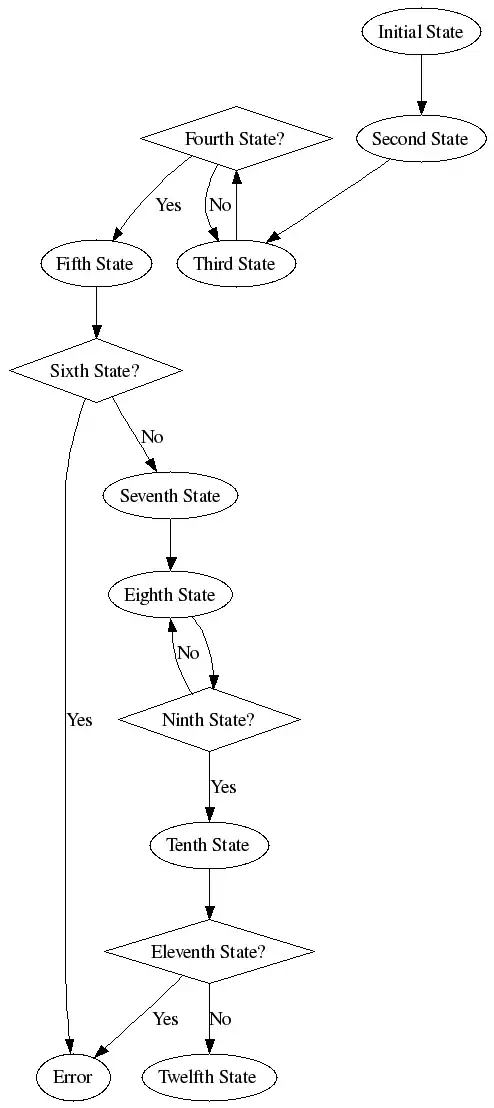
This produces a figure like so: enter image description here

I can imagine if your having multiple subplots within the figure, you would want to include the number of y and x subplots as keyword parameters (defaulting to 1 each) to the routine provided. Then using those numbers and the hspace and wspace keywords, you can make all the subplots have the correct aspect ratio.

Community
  • 1
  • 1
Yann
  • 33,811
  • 9
  • 79
  • 70
  • 1
    For cases where `get_images` is an empty list (as would happen with `ax.plot([0,1],[0,2])`, you can use `get_xlim` and `get_ylim` – Joel Oct 23 '16 at 20:21
  • It looks to me like this won't work if done with logscale. I've added an answer which tests for that and handles it. Feel free to incorporate that into your answer and then I'll remove mine. – Joel Jul 15 '17 at 22:21
  • 1
    The reason that the aspect looks unequal is because equal aspect means that visual distance in x will be the same as y. If the image is square, but the plot dx and dy are different, then that is not a 1:1 aspect ratio. The aspect ratio will be dy/dx in that case. – bart cubrich Feb 21 '19 at 22:54
25

What is the matplotlib version you are running? I have recently had to upgrade to 1.1.0, and with it, add_subplot(111,aspect='equal') works for me.

ev-br
  • 24,968
  • 9
  • 65
  • 78
  • 1
    Works well for me in `matplotlib` version `2.0.2`. `jupyter notebook` version `5.0.0`. Thanks. – Sathish Oct 02 '17 at 07:27
12

After many years of success with the answers above, I have found this not to work again - but I did find a working solution for subplots at

https://jdhao.github.io/2017/06/03/change-aspect-ratio-in-mpl

With full credit of course to the author above (who can perhaps rather post here), the relevant lines are:

ratio = 1.0
xleft, xright = ax.get_xlim()
ybottom, ytop = ax.get_ylim()
ax.set_aspect(abs((xright-xleft)/(ybottom-ytop))*ratio)

The link also has a crystal clear explanation of the different coordinate systems used by matplotlib.

Thanks for all great answers received - especially @Yann's which will remain the winner.

jtlz2
  • 7,700
  • 9
  • 64
  • 114
  • The link to https://jdhao.github.io/2017/06/03/change-aspect-ratio-in-mpl is very valuable. This is an ever more complete exposition: https://matplotlib.org/tutorials/advanced/transforms_tutorial.html – XavierStuvw Oct 13 '20 at 19:52
  • This answer is great. Here is my implementation: `fig = plt.figure(); ax = fig.add_subplot(111); ax.set_aspect(x.size / y.size)`. – Muhammad Yasirroni Oct 31 '22 at 01:12
  • For some unknown reason, this works for me with ratio=0.5. Since this is purely from visual appearance, that might be approximate. – sancho.s ReinstateMonicaCellio Dec 24 '22 at 11:18
5

In my case, the following setting works best:

plt.figure(figsize=(16,9))

where (16,9) is your plot aspect ratio.

4

you should try with figaspect. It works for me. From the docs:

Create a figure with specified aspect ratio. If arg is a number, use that aspect ratio. > If arg is an array, figaspect will determine the width and height for a figure that would fit array preserving aspect ratio. The figure width, height in inches are returned. Be sure to create an axes with equal with and height, eg

Example usage:

  # make a figure twice as tall as it is wide
  w, h = figaspect(2.)
  fig = Figure(figsize=(w,h))
  ax = fig.add_axes([0.1, 0.1, 0.8, 0.8])
  ax.imshow(A, **kwargs)

  # make a figure with the proper aspect for an array
  A = rand(5,3)
  w, h = figaspect(A)
  fig = Figure(figsize=(w,h))
  ax = fig.add_axes([0.1, 0.1, 0.8, 0.8])
  ax.imshow(A, **kwargs)

Edit: I am not sure of what you are looking for. The above code changes the canvas (the plot size). If you want to change the size of the matplotlib window, of the figure, then use:

In [68]: f = figure(figsize=(5,1))

this does produce a window of 5x1 (wxh).

joaquin
  • 82,968
  • 29
  • 138
  • 152
  • Thanks for this - it does have some effect, in changing the aspect ratio of the canvas: To be more specific, I need to change the aspect ratio of the figure itself, which doing the following does not (apols formatting..): fig = plt.figure(figsize=(plt.figaspect(2.0))) – jtlz2 Nov 01 '11 at 14:08
3

This answer is based on Yann's answer. It will set the aspect ratio for linear or log-log plots. I've used additional information from https://stackoverflow.com/a/16290035/2966723 to test if the axes are log-scale.

def forceAspect(ax,aspect=1):
    #aspect is width/height
    scale_str = ax.get_yaxis().get_scale()
    xmin,xmax = ax.get_xlim()
    ymin,ymax = ax.get_ylim()
    if scale_str=='linear':
        asp = abs((xmax-xmin)/(ymax-ymin))/aspect
    elif scale_str=='log':
        asp = abs((scipy.log(xmax)-scipy.log(xmin))/(scipy.log(ymax)-scipy.log(ymin)))/aspect
    ax.set_aspect(asp)

Obviously you can use any version of log you want, I've used scipy, but numpy or math should be fine.

Joel
  • 22,598
  • 6
  • 69
  • 93