I have the following input file for R:
car    1
car    2
car    3
car2   1
car2   2
car2   3
I then use the following commands to plot my graph:
autos_data <- read.table("~/Documents/R/test.txt", header=F)
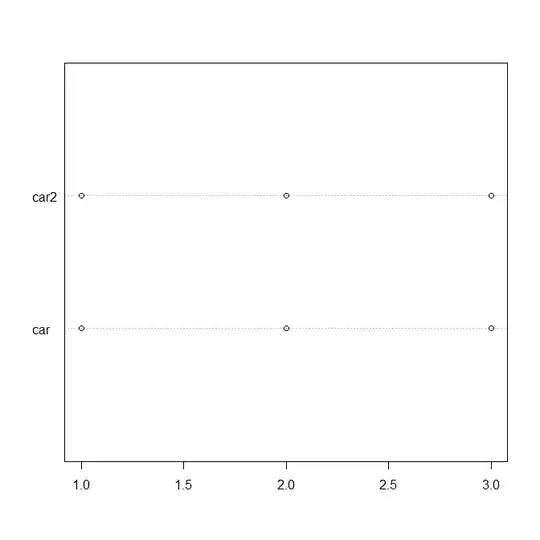
dotchart(autos_data$V2,autos_data$V1)
But this plots each car and car2 value on a new line, how can I plot the chart so that all the car values are on one line and all the car2 values are on another line.