4

I'm trying to combine 3 functions graphed on a Plot[] and 1 function graphed on a ParametricPlot[]. My equations are as follows:

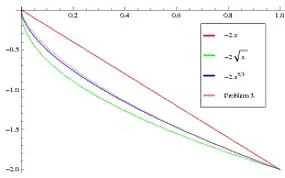
plota = Plot[{-2 x, -2 Sqrt[x], -2 x^(3/5)}, {x, 0, 1}, PlotLegend -> {"-2 x", "-2 \!\(\*SqrtBox[\(x\)]\)", "-2 \!\(\*SuperscriptBox[\(x\), \(3/5\)]\)"}]
plotb = ParametricPlot[{2.4056 (u - Sin[u]), 2.4056 (Cos[u] - 1)}, {u,0, 1.40138}, PlotLegend -> {"Problem 3"}]
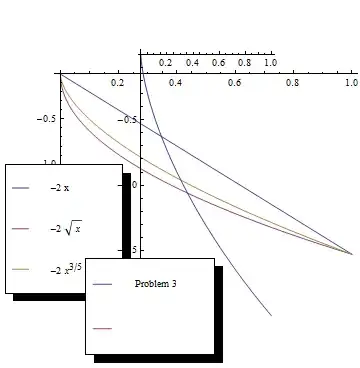
Show[plota, plotb]

This is the image it gives:

Combined Graph

Caleb Jares
  • 6,163
  • 6
  • 56
  • 83
  • 1
    This is the right place. Your math.se question is in the wrong place. Please delete that. You'll get answers here. – abcd Nov 22 '11 at 00:43
  • @yoda: thanks for per-emptively answering one of my questions. :) – sarnold Nov 22 '11 at 00:46

3 Answers3

6

As yoda said, PlotLegends is terrible. However, if you don't mind setting the plot styles manually and repeating them lateron, ShowLegend can help.

 plota = Plot[{-2 x, -2 Sqrt[x], -2 x^(3/5)}, {x, 0, 1}, 
              PlotStyle -> {{Red}, {Blue}, {Orange}}];
 plotb = ParametricPlot[{2.4056 (u - Sin[u]), 2.4056 (Cos[u] - 1)}, {u, 0, 1.40138}, 
                        PlotStyle -> {{Black}}];

And now

ShowLegend[Show[plota, plotb], 
          {{{Graphics[{Red, Line[{{0, 0}, {1, 0}}]}], Label1},          
            {Graphics[{Blue, Line[{{0, 0}, {1, 0}}]}], Label2},
            {Graphics[{Orange, Line[{{0, 0}, {1, 0}}]}], Label3}, 
            {Graphics[{Black, Line[{{0, 0}, {1, 0}}]}], Label4}},
           LegendSize -> {0.5, 0.5}, LegendPosition -> {0.5, -0.2}}]

which will give you this:

enter image description here

You can also write some simple functions to make this a little less cumbersome, if you deal with this problem often.

bbtrb
  • 4,065
  • 2
  • 25
  • 30
  • Oh, wow. I just edited my answer to add the exact same thing, and I see you posted a whole 10 minutes before my edit. I didn't get the notification while I was messing around in the editor, as I had already answered the post. Have a hearty upvote! :) – abcd Nov 22 '11 at 01:21
4

Well, the root cause of the error is the PlotLegends package, which is a terrible, buggy package. Removing that, Show combines them correctly:

plota = Plot[{-2 x, -2 Sqrt[x], -2 x^(3/5)}, {x, 0, 1}]
plotb = ParametricPlot[{2.4056 (u - Sin[u]), 2.4056 (Cos[u] - 1)}, {u,
    0, 1.40138}]
Show[plota, plotb]

enter image description here

You can see Simon's solution here for ideas to label your different curves without using PlotLegends. This answer by James also demonstrates why PlotLegends has the reputation it has...


You can still salvage something with the PlotLegends package. Here's an example using ShowLegends that you can modify to your tastes

colors = {Red, Green, Blue, Pink};
legends = {-2 x, -2 Sqrt[x], -2 x^(3/5), "Problem 3"};

plota = Plot[{-2 x, -2 Sqrt[x], -2 x^(3/5)}, {x, 0, 1}, 
   PlotStyle -> colors[[1 ;; 3]]];
plotb = ParametricPlot[{2.4056 (u - Sin[u]), 2.4056 (Cos[u] - 1)}, {u,
     0, 1.40138}, PlotStyle -> colors[[4]]];
ShowLegend[
 Show[plota, 
  plotb], {Table[{Graphics[{colors[[i]], Thick, 
      Line[{{0, 0}, {1, 0}}]}], legends[[i]]}, {i, 4}], 
  LegendPosition -> {0.4, -0.15}, LegendSpacing -> 0, 
  LegendShadow -> None, LegendSize -> 0.6}]

enter image description here

Community
  • 1
  • 1
abcd
  • 41,765
  • 7
  • 81
  • 98
  • I can't use the `fns[x_] :=` notation he is using, because I have a parametric equation. Can you show me how to add labels? Also, I imported an image into my LaTeX document, but it was too big so I scaled it by .5, which made it look pretty crappy. How can I make it smaller and still look nice? – Caleb Jares Nov 22 '11 at 01:10
  • Do you know of any good alternative package for legends? (Not somethingl like LevelScheme that totally redesigns the graphics system. Just plain legends.) – Szabolcs Nov 22 '11 at 08:40
  • @Szabolcs Sadly, I don't... Because of that, I tend to avoid labeling my curves (at most 3/plot) and instead label them in the figure caption text. – abcd Nov 22 '11 at 14:29
4

As the other answers pointed out, the culprit is PlotLegend. So, sometimes is useful to be able to roll your own plot legends:

plotStyle = {Red, Green, Blue};
labls = {"a", "b", "Let's go"};
f[i_, s_] := {Graphics[{plotStyle[[i]], Line[{{0, 0}, {1, 0}}]}, 
    ImageSize -> {15, 10}], Style[labls[[i]], s]};

Plot[{Sin[x], Sin[2 x], Sin[3 x]}, {x, 0, 2 Pi}, 
 PlotStyle -> plotStyle,
 Epilog ->
  Inset[Framed[Style@Column[{Grid[Table[f[i, 15], {i, 1, 3}]]}]],
   Offset[{-2, -2}, Scaled[{1, 1}]], {Right, Top}],
 PlotRangePadding -> 1
 ]

enter image description here

Dr. belisarius
  • 60,527
  • 15
  • 115
  • 190
  • Hey belisarius, I just realized that your top voted answer has more votes than any of the top voted answers of any of the top 12 all-time SO users. o_o – Mr.Wizard Nov 22 '11 at 12:28
  • 1
    @Mr. Yep. I lost my fortune bribing users :D. It was also the most voted non-CW answer. – Dr. belisarius Nov 22 '11 at 12:46
  • That answer is still reddit material. All belisarius needs to do (or maybe he is, already) is periodically post a link to reddit and title it _"Is rand() more random than rand()*rand()? OMG!! MIND = BLOWN!!!"_ and watch the upvotes trickle in for the next 5 days :P – abcd Nov 22 '11 at 15:18
  • @yoda I visited reddit only once, and I am not sure about the mechanics of the site. Could you do that for me? :D – Dr. belisarius Nov 22 '11 at 16:18