21

How can I label each of these lines separately :

Plot[{{5 + 2 x}, {6 + x}}, {x, 0, 10}]

enter image description here

500
  • 6,509
  • 8
  • 46
  • 80
  • 3
    possible duplicate: [Possible to put equation's expression near its graphic representation?](http://stackoverflow.com/q/1740305/211232) – WReach Aug 28 '11 at 13:48

3 Answers3

35

There's some nice code that allows you to do this dynamically in an answer to How to annotate multiple datasets in ListPlots.

There's also a LabelPlot command defined in the Technical Note Labeling Curves in Plots

Of course, if you don't have too many images to make, 
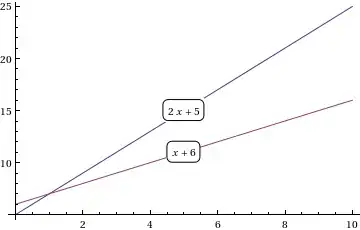
then it's not hard to manually add the labels in using Epilog, for example

fns[x_] := {5 + 2 x, 6 + x}; 
len := Length[fns[x]];

Plot[Evaluate[fns[x]], {x, 0, 10}, 
 Epilog -> Table[Inset[
    Framed[DisplayForm[fns[x][[i]]], RoundingRadius -> 5], 
    {5, fns[5][[i]]}, Background -> White], {i, len}]]

outputa

In fact, you can do something similar with Locators that allows you to move the labels wherever you want:

DynamicModule[{pos = Table[{1, fns[1][[i]]}, {i, len}]},
 LocatorPane[Dynamic[pos], Plot[Evaluate[fns[x]], {x, 0, 10}],
  Appearance -> Table[Framed[Text@TraditionalForm[fns[x][[i]]], 
                  RoundingRadius -> 5, Background -> White], {i, len}]]]

In the above I made the locators take the form of the labels, although it is also possible to keep an Epilog like that above and have invisible locators that control the positions. The locators could also be constrained (using the 2nd argument of Dynamic) to the appropriate curves... but that's not really necessary.

As an example of the above code with the functions with the labels moved by hand:

fns[x_] := {Log[x], Exp[x], Sin[x], Cos[x]};

four functions

Community
  • 1
  • 1
Simon
  • 14,631
  • 4
  • 41
  • 101
  • 9
    +1. It might not be *necessary* to constrain the locators to the lines, but it is pretty cool to do so. Try changing the `Dynamic` expression to `Dynamic[pos,(pos=MapIndexed[{##}/.{{x_, y_}, {i_}}:>{x,fns[x][[i]]}&,#])&]`. – WReach Aug 28 '11 at 15:13
  • 2
    @WReach: You're just the type of interested reader that I left this exercise to! Your code works nicely. – Simon Aug 28 '11 at 15:18
11

Mathematica 9 now provides easy ways to include legends.

Plot[{{5 + 2 x}, {6 + x}}, {x, 0, 10}, PlotLegends -> "Expressions"]
Shane C
  • 111
  • 1
  • 3
7

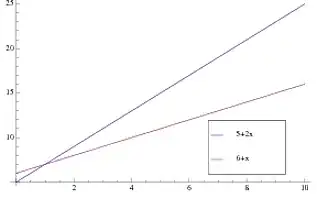
You can insert legends in your plot by loading the PlotLegends package

<<PlotLegends`;
Plot[{5+2 x,6+x},{x,0,10},
    PlotLegend->{"5+2x","6+x"},LegendShadow->None,
    LegendPosition->{0.3,-0.5},LegendSpacing->-0,LegendSize->0.5]

enter image description here


However, let me also note my dislike of this package, primarily because it's extremely counterintuitive, laden with too many options and does not provide a clean experience right out of the box like most of Mathematica's functions. You will have some fiddling around to do with the options to get what you want. However, in plots and charts where you do want a legend, this can be handy. Also see the comments to this answer and this question.

Community
  • 1
  • 1
abcd
  • 41,765
  • 7
  • 81
  • 98
  • The PlotLegends package is not optimal. See the [comments to this answer](http://stackoverflow.com/questions/6988983/how-to-annotate-multiple-datasets-in-listplots/6989679#6989679) and [this SO question](http://stackoverflow.com/q/3463437/421225). – Simon Aug 28 '11 at 14:40
  • 1
    @Simon: I know... I had a second part to my answer which I deleted before the 5 min window because I didn't want to pass any judgements. Here is what it said: _" However, let me also note my dislike of this package, primarily because it's extremely counterintuitive, laden with too many options and does not provide a clean experience right out of the box like most of Mathematica's functions. You will have some fiddling around to do with the options to get what you want. However, in plots and charts where you do want a legend, this can be handy."_ – abcd Aug 28 '11 at 14:43
  • I'll delete this answer after you've read my response. However, do add those two links above as a comment to the question (also noting that it's buggy). Perhaps all he wants is a legend and people have ways of complicating requests. – abcd Aug 28 '11 at 14:46
  • Leave the answer here! It's good to have the *standard* answer and a discussion of its strengths and weaknesses. – Simon Aug 28 '11 at 14:51
  • Alright, I've re-added what I removed and added your two links to the answer too. – abcd Aug 28 '11 at 14:57
  • 2
    Because `PlotLegends` is sub-par, I've used used the energy level diagram part of `LevelScheme` to create legends before. It's not automated, nor simple, but it worked and well. – rcollyer Aug 28 '11 at 16:32
  • @rcollyer True, I use `LevelScheme` for nearly all my publication plots. Some of the frustration in tweaking it and getting it right is only offset by the quality of the output and the granularity of control you have... – abcd Aug 28 '11 at 16:37
  • @Yoda, thank you. I actually opened the package and closed it. I am already dedicating so much time to plots :-) – 500 Aug 28 '11 at 20:50