16

When the mouse cursor is over a 2D plot in Wolfram|Alpha, a pair of grey lines appear that help you read the coordinates off the x and y axes. For example, I have the mouse over one of the turning points in the following plot of the Airy function.

Web

The above can also be obtained inside Mathematica using

WolframAlpha["Plot Ai(x)", {{"Plot", 1}, "Content"}]

Nb

which has the added advantage of some sort of locator showing the coordinates.


How can I emulate such behavior in a normal Mathematica graphics/plot?

Community
  • 1
  • 1
Simon
  • 14,631
  • 4
  • 41
  • 101
  • 1
    I'm sure you know this, but just in case you don't: right click on the graphics & choose "get coordinates". You can even mark points by clicking, and then copy them. This has been available since pre-6 versions. (Assuming your aim was to read off coordinates interactively.) – Szabolcs Nov 22 '11 at 08:17
  • @Szabolcs: Thanks, I did know that, but it's worth pointing out again! I was mainly looking to emulate the W|A code. I have my own code (I'll post later) that does most of it, but, among other things, it doesn't handle multiple graphs as well as the W|A code. – Simon Nov 22 '11 at 10:06
  • 2
    Just use `InputForm` on the result from `WolframAlpha[..]`... – Brett Champion Nov 22 '11 at 15:52
  • @Brett: That's where I stole the idea for dynamic `GridLines` from (used [here](http://stackoverflow.com/questions/6797651)). However, the `InputForm` seems to have got a lot messier since then - I guess as they added more features and made it handle more cases... – Simon Nov 22 '11 at 21:48
  • 1
    I came across this by accident. Try evaluating ``Experimental`Explore[Plot]``. – Szabolcs Jan 04 '12 at 17:21

4 Answers4

6

Here is one with the features you requested in comments:

locatorPlot[func_, r : {var_, __}, other___] :=
 LocatorPane[
   Dynamic[pos, (pos = {#, func /. var -> #}) & @@ # &],
   Column[{Plot[func, r, other], Dynamic@pos}],
   AutoAction -> True,
   Appearance ->
     Graphics[{Gray, Line @ {{{-1, 0}, {1, 0}}, {{0, -1}, {0, 1}}}},
       ImageSize -> Full]
 ]

locatorPlot[AiryAi[z], {z, -11, 5}, ImageSize -> 400]

enter image description here


Here is a rather clunky update to handle your new requests:

locatorPlot[func_List, r : {var_, __}, other___] :=
 DynamicModule[{pos, pos2},
  LocatorPane[
   Dynamic[pos, (pos = #; (pos2 = {#, First@Nearest[func /. var -> #, #2]}) & @@ #) &],
   Plot[func, r, other,
     Epilog ->
      {Text[\[GrayCircle], Dynamic@pos2], Text[Dynamic@pos2, Dynamic@pos2, {-1.2, 0}]}
   ],
   AutoAction -> True,
   Appearance -> 
     Graphics[{Gray, Line@{{{-1, 0}, {1, 0}}, {{0, -1}, {0, 1}}}}, ImageSize -> Full]
   ]
  ]

locatorPlot[{AiryAi[z], Sin[z]}, {z, -11, 5}, ImageSize -> 400]
Mr.Wizard
  • 24,179
  • 5
  • 44
  • 125
  • +1 That's nice! It's different from the W|A behaviour, but that's ok. Can you emulate the way the W|A code jumps to the nearest graph in plots of more than one function? Try running `WolframAlpha["Ai(x), Bi(x)", {{"Plot", 1}, "Content"}]` to see what I'm talking about. – Simon Nov 22 '11 at 10:09
  • @Simon I am sorry, I don't have that function. However, you are saying that the locator "snaps" to the nearest plot line, correct? – Mr.Wizard Nov 22 '11 at 10:22
  • I forgot you had an old version. Yep, the gray lines follow the mouse position, but the circle and text snaps to the curves. – Simon Nov 22 '11 at 10:25
  • What ever you think is best. I'm just trying to get some nice, clean, flexible code that does something similar to the W|A stuff. I'll post my code which is close to the W|A behaviour, except for its handling of multiple graphs. – Simon Nov 22 '11 at 11:02
  • @Simon, oops, missed you own post. I better take a quick look at that. :-) – Mr.Wizard Nov 22 '11 at 11:16
6

Here's another approach using Nearest, that's a bit different from Simon's:

plot = Plot[{Sin[x], Cos[x]}, {x, -2 Pi, 2 Pi}];
With[{nf = Nearest[Flatten[Cases[Normal[plot], Line[p_, ___] :> p, Infinity], 1]]},
   Show[plot, 
      Epilog -> 
         Dynamic[DynamicModule[{
            pt = First[nf[MousePosition[{"Graphics", Graphics}, {0, 0}]]], 
            scaled = Clip[MousePosition[{"GraphicsScaled", Graphics}, {0, 0}], {0, 1}]
            }, 
           {
            {If[scaled === None, {}, 
               {Lighter@Gray, Line[{
                   {Scaled[{scaled[[1]], 1}], Scaled[{scaled[[1]], 0}]}, 
                   {Scaled[{1, scaled[[2]]}], Scaled[{0, scaled[[2]]}]}
                   }]
               }]}, 
            {AbsolutePointSize[7], Point[pt], White, AbsolutePointSize[5], Point[pt]},
            Text[Style[NumberForm[Row[pt, ", "], {5, 2}], 12, Background -> White], Offset[{7, 0}, pt], {-1, 0}]}
         ]]
    ]
 ]

This was put together from example I had laying around. (I don't like the free-floating drop-lines combined with the point tracking; either on its own feels fine.)

Simon
  • 14,631
  • 4
  • 41
  • 101
Brett Champion
  • 8,497
  • 1
  • 27
  • 44
  • 1
    +1 I like how you get the `Nearest` point in the already generated graphic - it means for functions that are slow to numerically evaluate, you only need to evaluate them once for the plot. – Simon Nov 22 '11 at 21:28
5

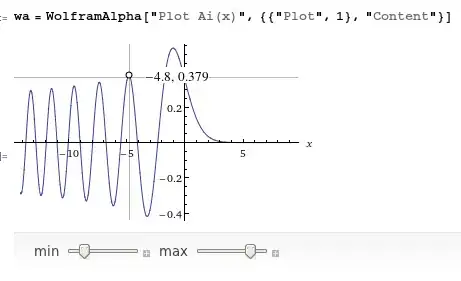
Here's my version that behaves similarly to the Wolfram|Alpha output, except for its handling of multiple plots. In the W|A graphics, the circle and the text jump to the nearest curve, and disappear completely when the cursor is not over the graphics. It would be nice to add in the missing functionality and maybe make the code more flexible.

WAPlot[fns_, range : {var_Symbol, __}] := 
 DynamicModule[{pos, fn = fns},
  If[Head[fn] === List, fn = First[Flatten[fn]]];
  LocatorPane[Dynamic[pos, (pos = {var, fn} /. var -> #[[1]]) &], 
   Plot[fns, range, Method -> {"GridLinesInFront" -> True},
    GridLines->Dynamic[{{#,Gray}}&/@MousePosition[{"Graphics",Graphics},None]]],
   AutoAction -> True, 
   Appearance -> Dynamic[Graphics[{Circle[pos, Scaled[.01]], 
       Text[Framed[Row[pos, ", "], RoundingRadius -> 5, 
         Background -> White], pos, {-1.3, 0}]}]]]]

Then, e.g.

WAPlot[{{AiryAi[x], -AiryAi[x]}, AiryBi[x]}, {x, -10, 2}]

enter image description here


Here's a new version that uses MousePosition instead of LocatorPane and steals Mr W's code to make the circle move to the nearest curve. The behaviour is now almost identical to the WolframAlpha output.

WAPlot[fns_, range : {var_Symbol, __}] := 
 DynamicModule[{fnList = Flatten[{fns}]}, Plot[fnList, range,
   GridLines -> 
    Dynamic[{{#, Gray}} & /@ MousePosition[{"Graphics", Graphics}]],
   Method -> {"GridLinesInFront" -> True},
   Epilog -> Dynamic[With[{mp = MousePosition[{"Graphics", Graphics}, None]},
      If[mp === None, {}, 
       With[{pos = {#1, First@Nearest[fnList /. var -> #1, #2]}& @@ mp},
        {Text[Style["\[EmptyCircle]", Medium, Bold], pos], 
         Text[Style[NumberForm[Row[pos, ", "], 2], Medium], pos, 
          {If[First[MousePosition["GraphicsScaled"]] < .5, -1.3, 1.3], 0}, 
          Background -> White]}]]]]
   ]]

The output looks very similar to the previous version so I won't post a screenshot.

Simon
  • 14,631
  • 4
  • 41
  • 101
  • Please tell me you didn't have this code when you asked the question, or I'm gonna shoot ya. ;-p – Mr.Wizard Nov 22 '11 at 11:18
  • @Mr.Wizard: I had it in separate pieces... just had to assemble it. I guess it's a good thing we live on opposite sides of the planet! – Simon Nov 22 '11 at 11:21
  • I think you can adapt what I posted with `Nearest` etc., to make this functional. Let me know if you have trouble. – Mr.Wizard Nov 22 '11 at 11:23
2

From Jens-Peer Kuska:

Manipulate[myPosition = p;
 Plot[Sin[x], {x, 0, Pi}, 
  Epilog -> {Point[p], Text[p, p + {0.4, 0}]}], {{p, {0, 0}}, 
  Locator}]

From Mark McClure:

labeledPointPlot[g_Graphics] := 
  Manipulate[
   Column[{Show[{g, Graphics@Point[pt]}], pt}], {pt, 
    Sequence @@ Transpose[PlotRange /. FullOptions[g]], Locator}];

labeledPointPlot[Plot[x^2, {x, -2, 2}]]

I found the origin of the code above, which I had previously written down:

http://www.mathkb.com/Uwe/Forum.aspx/mathematica/10416/Mathematica-6-Graphics-Options

Mr.Wizard
  • 24,179
  • 5
  • 44
  • 125
  • Hi Mr.W, I was more after the gray "crosshairs" than the locator showing the coordinates... I'm sorry that wasn't clear in the question. Also, the locator produced by `WolframAlpha` has [AutoAction](http://reference.wolfram.com/mathematica/ref/AutoAction.html) and follows the curve... – Simon Nov 22 '11 at 07:18
  • @Simon, I couldn't try that function so I didn't know. See my new answer below. I'll see what I can do about the actual lines. – Mr.Wizard Nov 22 '11 at 07:35
  • @Simon, okay, I've got it. Update in a minute. – Mr.Wizard Nov 22 '11 at 07:58