7

Node Assignment Problem

enter image description here

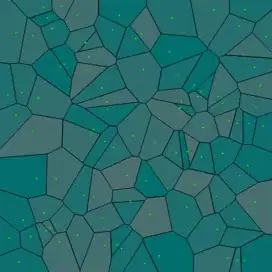
The problem I want to solve is to tessellate the map given with the Blue Nodes(Source Nodes) as given input points, Once I am able to do this I would like to see how many Black Nodes(Demand Nodes) fall within each cell and assign it to the Blue Node associated with that cell.

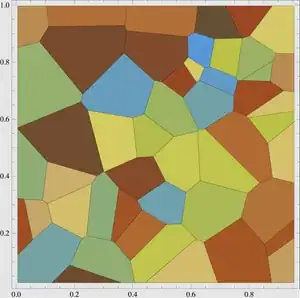
I would like to know if there is a easier way of doing this without using Fortune's Algorithm.I came across this function under Mahotas called Mahotas.segmentation.gvoronoi(image)source. But I am not sure if this will solve my problem.

Also please suggest me if there is a better way of doing this segmentation(other than Voronoi tessellation). I am not sure if clustering algorithms would be a good choice. I am a programming newbie.

Jason Sundram
  • 12,225
  • 19
  • 71
  • 86
user1071530
  • 113
  • 1
  • 3
  • 9
  • regarding your first question (about Mahotas.segmentation.gvoronoi): have you tried it? What were the results like? – bpgergo Nov 29 '11 at 17:23
  • This is a image processing function. I tried to tessalate without the DN(Black Nodes) and gave multiple colors to the Source Node(instead of just blue). I got the segmentation similar to this [link](http://pythonvision.org/media/files/images/whole-segmented.png) – user1071530 Nov 29 '11 at 17:32
  • This site does node assignment: http://vpartition.meteor.com/ – FullStack Aug 17 '15 at 08:41

6 Answers6

9

Here is an alternative approach to using Voronoi tessellation:

Build a k-d tree over the source nodes. Then for every demand node, use the k-d tree to find the nearest source node and increment a counter associated with that nearby source node.

The implementation of a k-d tree found at http://code.google.com/p/python-kdtree/ should be useful.

wye.bee
  • 708
  • 4
  • 11
  • Thanks! I will look into this method. – user1071530 Nov 29 '11 at 19:50
  • you can also use the kdtree in SciPy (scipy.spatial.kdtree) – Jason Sundram Nov 29 '11 at 20:39
  • @wye.bee I used the k-d tree method you suggested and it helped me solve this problem and other instances of it. Even though I can see the use of this algorithm, I am not able to intuitively grasp how this is working. Do you recommend any books or tutorials that might help. – user1071530 Dec 05 '11 at 22:19
  • Wikipedia is a good place to start (note it also has more links to related material at the bottom). http://en.wikipedia.org/wiki/K-d_tree – Tim Gee Dec 27 '11 at 16:25
2

I've just been looking for the same thing and found this:

https://github.com/Softbass/py_geo_voronoi

Malcolm Murdoch
  • 1,075
  • 6
  • 9
1

There's not many points in your diagram. That suggests you can, for each demand node, just iterate through all the source nodes and find the nearest one.

Perhaps this:

def distance(a, b):
    return sum((xa - xb) ** 2 for (xa, xb) in zip(a, b))

def clusters(sources, demands):
    result = dict((source, []) for source in sources)
    for demand in demands:
        nearest = min(sources, key=lambda s: distance(s, demand))
        result[nearest].append(demand)
    return result

This code will give you a dictionary, mapping source nodes to a list of all demand nodes which are closer to that source node than any other.

This isn't particularly efficient, but it's very simple!

1

I think the spatial index answer by https://stackoverflow.com/users/1062447/wye-bee (A kd-tree for example) is the easiest solution to your problem.

Additionally, you did also ask is there an easier alternative to Fortune's algorithm and for that particular question I refer you to: Easiest algorithm of Voronoi diagram to implement?

Community
  • 1
  • 1
Tim Gee
  • 1,062
  • 7
  • 9
0

You did not say why you wanted to avoid Fortune's algorithm. I assume you meant that you just didn't want to implement it yourself, but it has already been implemented in a script by Bill Simons and Carston Farmer so computing the voronoi diagram shouldn't be difficult.

Building on their script I made it even easier to use and uploaded it to PyPi under the name Pytess. So you could use the pytess.voronoi() function based on the blue points as input, returning the original points with their computed voronoi polygons. Then you would have to assign each black point through point-in-polygon testing, which you could base on http://geospatialpython.com/2011/08/point-in-polygon-2-on-line.html.

enter image description here

Karim Bahgat
  • 2,781
  • 3
  • 21
  • 27
-1

Run this code in Mathematica. It's spectacular! (Yes, I know it is not Python, but ...)

pts3 = RandomReal[1, {50, 3}];
ListDensityPlot[pts3, 
    InterpolationOrder -> 0, ColorFunction -> "SouthwestColors", Mesh -> All]

          Voronoi Diagram

Joseph O'Rourke
  • 4,346
  • 16
  • 25