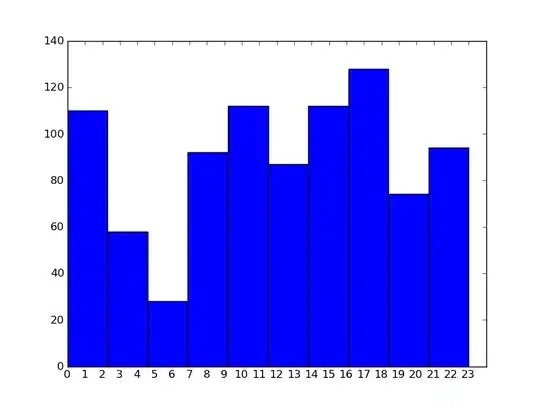
I am trying to plot a histogram of datetime.time values. Where these values are discretized into five minute slices. The data looks like this, in a list:
['17:15:00', '18:20:00', '17:15:00', '13:10:00', '17:45:00', '18:20:00']
I would like to plot a histogram, or some form of distribution graph so that the number of occurrences of each time can be examined easily.
NB. Given each time is discretised then. The maximum number of bins in a histogram would be 288 = (60 / 5 * 24)
I have looked at matplotlib.pyplot.hist. But is requires some sort of continuous scalar
