51

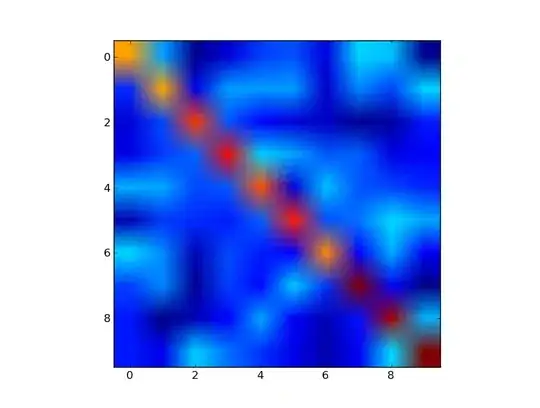
When I use matplotlib's imshow() method to represent a small numpy matrix, it ends up doing some smoothing between pixels. Is there any way to disables this? It makes my figure's misleading in presentations.A 28x28 matrix plotted with imshow()

The figure above is a 28x28 image, so I should be seeing large squares of single colors representing each pixel (as matlab would display it when using imagesc()). But Instead, the pixels seem to be blurred with neighboring pixels. Is there a way to disable this behavior?

Christopher Dorian
  • 2,163
  • 5
  • 21
  • 25

2 Answers2

56

There is an interpolation option for imshow which controls how and if interpolation will be applied to the rendering of the matrix. If you try

imshow(array, interpolation="nearest") 

you might get something more like you want. As an example

A=10*np.eye(10) + np.random.rand(100).reshape(10,10)
imshow(A)

imshow(A)

compared with

A=10*np.eye(10) + np.random.rand(100).reshape(10,10)
imshow(A, interpolation="nearest")

enter image description here

talonmies
  • 70,661
  • 34
  • 192
  • 269
  • Thanks, that seems to work. Out of curiosity, why is it called 'nearest' for interpolation? The documentation on this page: http://matplotlib.sourceforge.net/api/pyplot_api.html#matplotlib.pyplot.imshow doesn't describe what 'nearest' does. – Christopher Dorian Dec 05 '11 at 05:43
  • 4
    To be honest, I don't know. In the development tree there is now also an `interpolation="none"` option which does pretty much the same thing. [This example](http://matplotlib.sourceforge.net/examples/pylab_examples/image_interp.html) provides a little more information on what `interpolation="nearest"`is trying to achieve. – talonmies Dec 05 '11 at 07:02
  • 9
    it is maybe trying to sample from the 'nearest' neighbour? in the vicinity of the display pixel – DrSAR Dec 06 '11 at 01:07
  • it is indeed 'nearest neighbour' interpolation – wim Dec 12 '11 at 02:35
  • 3
    @ChristopherDorian , just comming here 4 years late, but the difference between nearest and none: http://matplotlib.org/examples/images_contours_and_fields/interpolation_none_vs_nearest.html – Ander Biguri Sep 08 '15 at 14:46
20

you can also try the function

matshow 

which name indicated that it does exactly what you asked - represent matrices. It is quite handy when you do not need to customise the figure too much.

BTW, one of the best resources for matplotlib is their Gallery

eldad-a
  • 3,051
  • 3
  • 22
  • 25