51

I want to annotate the bars in a graph with some text but if the bars are close together and have comparable height, the annotations are above ea. other and thus hard to read (the coordinates for the annotations were taken from the bar position and height).

Is there a way to shift one of them if there is a collision?

Edit: The bars are very thin and very close sometimes so just aligning vertically doesn't solve the problem...

A picture might clarify things: bar pattern

Trenton McKinney
  • 56,955
  • 33
  • 144
  • 158
BandGap
  • 1,745
  • 4
  • 19
  • 26

4 Answers4

62

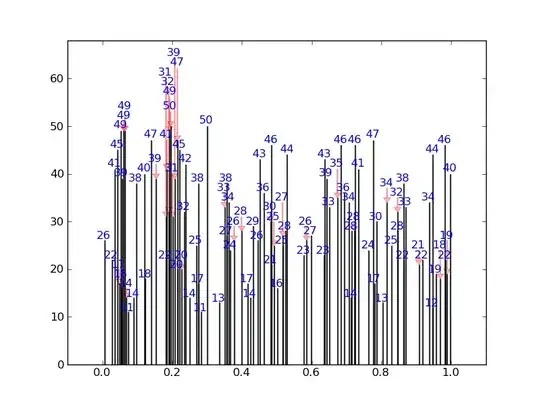
I've written a quick solution, which checks each annotation position against default bounding boxes for all the other annotations. If there is a collision it changes its position to the next available collision free place. It also puts in nice arrows.

For a fairly extreme example, it will produce this (none of the numbers overlap): enter image description here
Instead of this: enter image description here

Here is the code:

import numpy as np
import matplotlib.pyplot as plt
from numpy.random import *

def get_text_positions(x_data, y_data, txt_width, txt_height):
    a = zip(y_data, x_data)
    text_positions = y_data.copy()
    for index, (y, x) in enumerate(a):
        local_text_positions = [i for i in a if i[0] > (y - txt_height) 
                            and (abs(i[1] - x) < txt_width * 2) and i != (y,x)]
        if local_text_positions:
            sorted_ltp = sorted(local_text_positions)
            if abs(sorted_ltp[0][0] - y) < txt_height: #True == collision
                differ = np.diff(sorted_ltp, axis=0)
                a[index] = (sorted_ltp[-1][0] + txt_height, a[index][1])
                text_positions[index] = sorted_ltp[-1][0] + txt_height
                for k, (j, m) in enumerate(differ):
                    #j is the vertical distance between words
                    if j > txt_height * 2: #if True then room to fit a word in
                        a[index] = (sorted_ltp[k][0] + txt_height, a[index][1])
                        text_positions[index] = sorted_ltp[k][0] + txt_height
                        break
    return text_positions

def text_plotter(x_data, y_data, text_positions, axis,txt_width,txt_height):
    for x,y,t in zip(x_data, y_data, text_positions):
        axis.text(x - txt_width, 1.01*t, '%d'%int(y),rotation=0, color='blue')
        if y != t:
            axis.arrow(x, t,0,y-t, color='red',alpha=0.3, width=txt_width*0.1, 
                       head_width=txt_width, head_length=txt_height*0.5, 
                       zorder=0,length_includes_head=True)

Here is the code producing these plots, showing the usage:

#random test data:
x_data = random_sample(100)
y_data = random_integers(10,50,(100))

#GOOD PLOT:
fig2 = plt.figure()
ax2 = fig2.add_subplot(111)
ax2.bar(x_data, y_data,width=0.00001)
#set the bbox for the text. Increase txt_width for wider text.
txt_height = 0.04*(plt.ylim()[1] - plt.ylim()[0])
txt_width = 0.02*(plt.xlim()[1] - plt.xlim()[0])
#Get the corrected text positions, then write the text.
text_positions = get_text_positions(x_data, y_data, txt_width, txt_height)
text_plotter(x_data, y_data, text_positions, ax2, txt_width, txt_height)

plt.ylim(0,max(text_positions)+2*txt_height)
plt.xlim(-0.1,1.1)

#BAD PLOT:
fig = plt.figure()
ax = fig.add_subplot(111)
ax.bar(x_data, y_data, width=0.0001)
#write the text:
for x,y in zip(x_data, y_data):
    ax.text(x - txt_width, 1.01*y, '%d'%int(y),rotation=0)
plt.ylim(0,max(text_positions)+2*txt_height)
plt.xlim(-0.1,1.1)

plt.show()
fraxel
  • 34,470
  • 11
  • 98
  • 102
  • quite nice. Is there also a way to generalise this onto non-bar grafics? I am trying to annotate a scatterplot, and naturally it would be nice if the distance of the Arrows were to be minimized, too. Also is it possible to minimize the amount of arrows going through numbers? – tarrasch May 24 '12 at 14:51
  • @tarrasch - This principle should work ok for any kind of plot. Hopefully I'll have time to knock the code into more attractive shape in the next couple of days (it needs to be generalised, as I mentioned). The distance of the arrows can be reduced a little (change `2*L` to `L`), but the arrows kind of have to go through numbers sometimes (it'll start getting a lot more complex to avoid that), however if you change the arrows `alpha` setting to `alpha=0.3`, and the text `color` to blue, the plot starts to look even better. – fraxel May 24 '12 at 20:15
  • nice! i'll try it out this afternoon :) – tarrasch May 25 '12 at 06:44
  • @tarrasch - cool, I've improved it a bit, and ditched the need for recursion :) – fraxel May 25 '12 at 09:52
  • hm i think you broke it. where does this text_positioner come from? do you mean get_text_positions? – tarrasch May 30 '12 at 16:17
  • @tarrasch - Hey, sorry somehow I didn't see your comment until now. You're right somehow, I messed up my last edit. I've corrected it now. Eventually it would be best to just pass a list of annotation strings formatted as they should finally appear to `get_text_positions`, and it should be able to cope with variable lengths, setting bounding boxes automatically. Then `text_plotter` wouldn't do any text formatting, which would make more sense. I may try and address this in the future :) – fraxel Jun 06 '12 at 09:36
  • What modification needs to be made to make this start to spiral around the spot if there is an overlap, instead of just stack? I'm doing a scatter plot and things are stacking ten-fifteen high off the graph in order to not overlap, and then their position becomes meaningless (again, it's an annotation for a scatter plot, so the (x,y) position is important). – Jared Apr 27 '15 at 11:44
  • I too would be interested in a modification to this code in order to resolve the problem Jared outlined above. Is there a particular modification that must be made to avoid mis-positioning and overlap? – edesz Jul 14 '15 at 00:11
  • How would you modify this for generic annotations that aren't contingent on the value of the y-axis? – Elliptica Dec 20 '16 at 00:19
  • 1
    this is quite old now, but the get_text_positions function is broken. Under the comment `#True == collision`, the line begnning with `a[index]` throws an error that zip objects are not subscriptable. Looks like this is a Python 2->3 issue. That error can be fixed by modifying the first line of the function to: `a = list( zip( y_data, x_data ) )` – pedro pablo león jaramillo Feb 24 '23 at 19:23
15

Another option using my library adjustText, written specially for this purpose (https://github.com/Phlya/adjustText). I think it's probably significantly slower that the accepted answer (it slows down considerably with a lot of bars), but much more general and configurable.

from adjustText import adjust_text
np.random.seed(2017)
x_data = np.random.random_sample(100)
y_data = np.random.random_integers(10,50,(100))

f, ax = plt.subplots(dpi=300)
bars = ax.bar(x_data, y_data, width=0.001, facecolor='k')
texts = []
for x, y in zip(x_data, y_data):
    texts.append(plt.text(x, y, y, horizontalalignment='center', color='b'))
adjust_text(texts, add_objects=bars, autoalign='y', expand_objects=(0.1, 1),
            only_move={'points':'', 'text':'y', 'objects':'y'}, force_text=0.75, force_objects=0.1,
            arrowprops=dict(arrowstyle="simple, head_width=0.25, tail_width=0.05", color='r', lw=0.5, alpha=0.5))
plt.show()

enter image description here

If we allow autoalignment along x axis, it gets even better (I just need to resolve a small issue that it doesn't like putting labels above the points and not a bit to the side...).

np.random.seed(2017)
x_data = np.random.random_sample(100)
y_data = np.random.random_integers(10,50,(100))

f, ax = plt.subplots(dpi=300)
bars = ax.bar(x_data, y_data, width=0.001, facecolor='k')
texts = []
for x, y in zip(x_data, y_data):
    texts.append(plt.text(x, y, y, horizontalalignment='center', size=7, color='b'))
adjust_text(texts, add_objects=bars, autoalign='xy', expand_objects=(0.1, 1),
            only_move={'points':'', 'text':'y', 'objects':'y'}, force_text=0.75, force_objects=0.1,
            arrowprops=dict(arrowstyle="simple, head_width=0.25, tail_width=0.05", color='r', lw=0.5, alpha=0.5))
plt.show()

enter image description here

(I had to adjust some parameters here, of course)

Phlya
  • 5,726
  • 4
  • 35
  • 54
  • The readme says that it turns texts into annotations. Does that mean it won't work if annotations that are overlapping is what I have to start with? – Joseph Garvin Feb 24 '17 at 18:23
  • @JosephGarvin no, currently it doesn't support annotations, it has to start with text objects. – Phlya Feb 24 '17 at 18:25
9

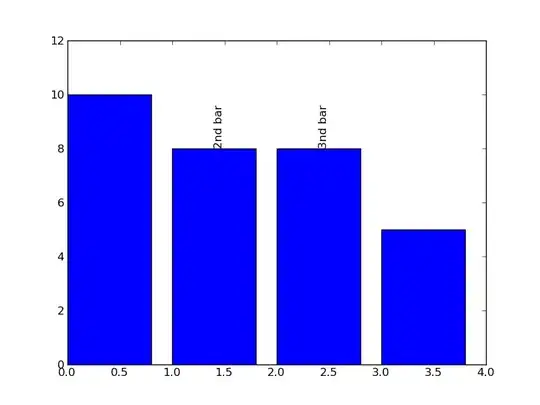
One option is to rotate the text/annotation, which is set by the rotation keyword/property. In the following example, I rotate the text 90 degrees to guarantee that it wont collide with the neighboring text. I also set the va (short for verticalalignment) keyword, so that the text is presented above the bar (above the point that I use to define the text):

import matplotlib.pyplot as plt

data = [10, 8, 8, 5]

fig = plt.figure()
ax = fig.add_subplot(111)
ax.bar(range(4),data)
ax.set_ylim(0,12)
# extra .4 is because it's half the default width (.8):
ax.text(1.4,8,"2nd bar",rotation=90,va='bottom')
ax.text(2.4,8,"3nd bar",rotation=90,va='bottom')

plt.show()

The result is the following figure:

enter image description here

Determining programmatically if there are collisions between various annotations is a trickier process. This might be worth a separate question: Matplotlib text dimensions.

Community
  • 1
  • 1
Yann
  • 33,811
  • 9
  • 79
  • 70
  • This answers the question for somewhat wider bars but in my case they are very thin and very close so even vertical alignment wouldn't do. I also thought about some bounding box collision testing but this will increase the complexity far beyond the time I'm willing to spend on this :) – BandGap Jan 13 '12 at 15:41
  • @BandGap, then I would do this manually, setting the annotation position at the top of each bar and adjusting the text position until they don't collide (by adjusting the y component only), and I would define an arrowstyle, like they do in the annotating axes section of the user guide: http://matplotlib.sourceforge.net/users/annotations_guide.html#annotating-axes This allows an arrow to point from your label to your bar and the lines of text to be separated from one another. Let me know this suggestion is not clear. – Yann Jan 13 '12 at 15:52
  • 3
    If I had to do it manually I could simply print it out and add text by hand. Since I need several plots with changing bar position and height this is not feasible (apart from the fact that there are several tens of bars) – BandGap Jan 13 '12 at 15:58
1

Just thought I would provide an alternative solution that I just created textalloc that makes sure that text-boxes avoids overlap with both each other and lines when possible, and is fast.

For this example you could use something like this:

import textalloc as ta
import numpy as np
import matplotlib.pyplot as plt

np.random.seed(2017)
x_data = np.random.random_sample(100)
y_data = np.random.random_integers(10,50,(100))

f, ax = plt.subplots(dpi=200)
bars = ax.bar(x_data, y_data, width=0.002, facecolor='k')
ta.allocate_text(f,ax,x_data,y_data,
            [str(yy) for yy in list(y_data)],
            x_lines=[np.array([xx,xx]) for xx in list(x_data)],
            y_lines=[np.array([0,yy]) for yy in list(y_data)], 
            textsize=8,
            margin=0.004,
            min_distance=0.005,
            linewidth=0.7,
            textcolor="b")
plt.show()

This results in this enter image description here

ckjellson
  • 31
  • 3