My question is similar to the following post, the only thing I need is to place the titles of each subplot below each figure instead of on the top.
Place title of multiplot panel with ggplot2
Suggestion from baptiste working fine but, I have just two figures and I want them side by side.
p = qplot(1,1)
lp = list(p,p)
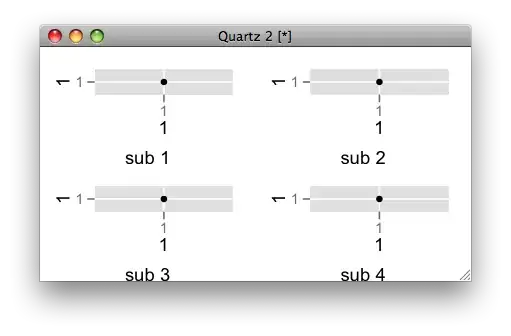
ll = list("sub 1", "sub 2")
plotlist <- mapply(arrangeGrob, lp, sub=ll, SIMPLIFY=FALSE)
do.call(grid.arrange, plotlist)
Thanks