29

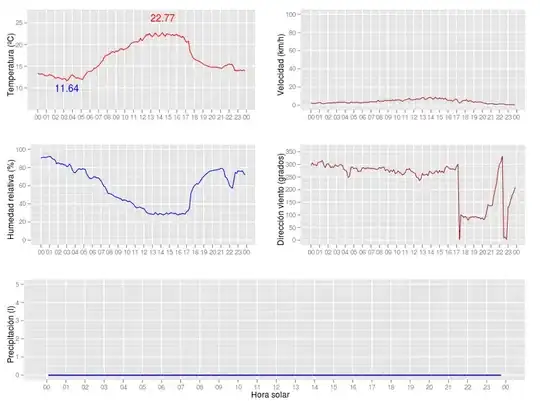
From the help found here I've managed to create this multiplot panel: enter image description here with the following code:
library(zoo)
library(ggplot2)

datos=read.csv("paterna.dat",sep=";",header=T,na.strings="-99.9")

datos$dia=as.POSIXct(datos[,1], format="%y/%m/%d %H:%M:%S")

datos$Precipitación[is.na(datos$Precipitación)]=0
xlim = as.POSIXct(c("2010-05-12 00:00:00", "2010-05-12 23:50:00"))
ylim = trunc(max(datos$Precipitación) + 5)
tmax = trunc(max(datos$Temperatura) + 5)
tmin = trunc(min(datos$Temperatura) - 5)

tmx = max(datos$Temperatura) 
tmxpos=which.max(datos$Temperatura) 
tmn = min(datos$Temperatura) 
tmnpos=which.min(datos$Temperatura) 

tmp=ggplot(data=datos,aes(x=dia, y=Temperatura)) + geom_line(colour="red") + ylab("Temperatura (ºC)") + 
xlab(" ") + scale_x_datetime(limits=xlim ,format = "%H",major='hour') + scale_y_continuous(limits = c(tmin,tmax)) + geom_text(data=datos[tmxpos,], label=tmx, vjust=-1.5, colour="red") + geom_text(data=datos[tmnpos,], label=tmn, vjust=1.5, colour="blue")

pre=ggplot(data=datos,aes(x=dia, y=Precipitación)) + geom_bar(colour="blue",stat="identity",fill="blue") +
ylab("Precipitación (l)") + xlab("Hora solar") + scale_x_datetime(limits=xlim ,format = "%H",major='hour') + scale_y_continuous(limits=c(0,ylim))

vel=ggplot(data=datos,aes(x=dia, y=Velocidad)) + geom_line(colour="brown") + ylab("Velocidad (km/h)") + xlab(" ")  + scale_x_datetime(limits=xlim ,format = "%H",major='hour') + scale_y_continuous(limits = c(0,100))

dir=ggplot(data=datos,aes(x=dia, y=Dirección)) + geom_line(colour="brown") + ylab("Dirección viento (grados)") + xlab(" ") + scale_x_datetime(limits=xlim ,format = "%H",major='hour') + scale_y_continuous(limits = c(0,360))

hum=ggplot(data=datos,aes(x=dia, y=Humedad.Relativa)) + geom_line(colour="blue") + ylab("Humedad relativa (%)") + xlab(" ") + scale_x_datetime(limits=xlim ,format = "%H",major='hour') + scale_y_continuous(limits = c(0,100))

grid.newpage()
pushViewport(viewport(layout = grid.layout(3, 2)))   
print(tmp, vp = viewport(layout.pos.row = 1, layout.pos.col = 1))         
print(vel, vp = viewport(layout.pos.row = 1, layout.pos.col = 2))
print(dir, vp = viewport(layout.pos.row = 2, layout.pos.col = 2))
print(hum, vp = viewport(layout.pos.row = 2, layout.pos.col = 1))
print(pre, vp = viewport(layout.pos.row = 3, layout.pos.col = 1:2))

Now I'm missing the title of the multiplot that I want to be the met. station name. I haven't found how to set main title on grid.newpage or viewport. I've read about grid.arrange but couldn't figure out how to use it in my case.

How can this be done? For sure it's gonna be an easy question for you.

You can find source data in http://ubuntuone.com/4G01ifn7cJ1jMIOKh

Thanks in advance

UPDATE: Thanks to koshke I found the solution. The working code is:

grid.newpage()
pushViewport(viewport(layout = grid.layout(4, 2, heights = unit(c(0.5, 5, 5, 5), "null"))))   
grid.text("MAIN TITLE", vp = viewport(layout.pos.row = 1, layout.pos.col = 1:2))
print(tmp, vp = viewport(layout.pos.row = 2, layout.pos.col = 1))         
print(vel, vp = viewport(layout.pos.row = 2, layout.pos.col = 2))
print(dir, vp = viewport(layout.pos.row = 3, layout.pos.col = 2))
print(hum, vp = viewport(layout.pos.row = 3, layout.pos.col = 1))
print(pre, vp = viewport(layout.pos.row = 4, layout.pos.col = 1:2))
Marijn
  • 10,367
  • 5
  • 59
  • 80
pacomet
  • 5,011
  • 12
  • 59
  • 111
  • from [this document](http://www.google.at/url?sa=t&rct=j&q=push.viewport()%20title%20for&source=web&cd=2&ved=0CCYQFjAB&url=http%3A%2F%2Fstat.ethz.ch%2FR-manual%2FR-devel%2Flibrary%2Fgrid%2Fdoc%2Fviewports.pdf&ei=62b0TsOsD6ni4QTJwMmNCA&usg=AFQjCNHHdoDtfIENYhX4HsbkNArFtl91Yw&cad=rja) i found the command (last page but one) but I'm not sure if it is what you are looking for `grid.text("The user adds a title!", gp = gpar(fontsize = 20))` – Seb Dec 23 '11 at 11:34
  • @Seb, maybe it's possible to adapt. I think I have to name viewports and then look for the one I want to place the text in. Not sure if it's gonna work but will try. Thanks – pacomet Dec 23 '11 at 11:54
  • the document linked describes how to get the viewport you're looking for - sorry that i can't be much of a help but i have no experience with this! – Seb Dec 23 '11 at 11:55
  • Tried but not completely working, it plots the title right in the center of the page maybe because there is only one viewport. It's promising so I have to go deeper in viewports. Thanks – pacomet Dec 23 '11 at 12:12

3 Answers3

28
library(gridExtra)

p <- ggplot()

grid.arrange(p,p,p,p,p, top = "Title",
            layout_matrix = matrix(c(1,2,3,4,5,5), ncol=2, byrow=TRUE))

enter image description here

baptiste
  • 75,767
  • 19
  • 198
  • 294
  • 3
    Could you explain this a bit? – Davoud Taghawi-Nejad Jul 27 '12 at 20:33
  • @DavoudTaghawi-Nejad https://github.com/baptiste/gridextra/wiki/arrangeGrob#title-andor-annotations – rawr May 11 '16 at 13:16
  • @rawr, this link is dead I'm afraid – DaveRGP Apr 04 '18 at 16:33
  • 2
    @DaveRGP I think [this](https://cran.r-project.org/web/packages/gridExtra/vignettes/arrangeGrob.html#title-andor-annotations) is it, [this](https://cran.r-project.org/web/packages/gridExtra/vignettes/gtable.html) might also be useful. I'm not sure why baptiste's repo is gone from his github page – rawr Apr 04 '18 at 22:07
23

If I understand correctly what you want to do, probably you can use +opts(title = XXX):

p1 <- ggplot(mtcars, aes(factor(cyl))) + geom_bar()
p2 <- ggplot(mtcars, aes(wt, mpg)) + geom_point()
p3 <- p2 + geom_line()

pushViewport(viewport(layout = grid.layout(2, 2)))  
print(p1 + opts(title = "bar"), 
  vp = viewport(layout.pos.row = 1, layout.pos.col = 1))     
print(p2 + opts(title = "point"), 
  vp = viewport(layout.pos.row = 1, layout.pos.col = 2))     
print(p3 + opts(title = "point and line"), 
  vp = viewport(layout.pos.row = 2, layout.pos.col = 1:2))

enter image description here

UPDATED

here is an example:

pushViewport(viewport(layout = grid.layout(3, 2, heights = unit(c(1, 4, 4), "null"))))
grid.text("title of this panel", vp = viewport(layout.pos.row = 1, layout.pos.col = 1:2))
print(p1, vp = viewport(layout.pos.row = 2, layout.pos.col = 1))
print(p2, vp = viewport(layout.pos.row = 2, layout.pos.col = 2))
print(p3, vp = viewport(layout.pos.row = 3, layout.pos.col = 1:2))

what you need to do is:

  1. Make one extra row in grid.layout
  2. Adjust width
  3. Draw textGrob on the extra viewport row.

enter image description here

kohske
  • 65,572
  • 8
  • 165
  • 155
  • This is not what I need, maybe I didn't explain well. Data comes from a meteorological station, then I want to place the station name and date (a title) on top of the panel. I don't need a title in each graph (I removed them from my first try) as the y axis also names the graph. Thanks. – pacomet Dec 23 '11 at 12:16
  • OK, I have updated. At the moment, layout for ggplot2 is not straightforward. Maybe it will be more easy in future. – kohske Dec 23 '11 at 12:30
1

Nowadays you can use the really helpful package patchwork to easily combine multiple plots in one graph. To add a main title to the multiple graphs, you can use plot_annotation. Here is a reproducible example using the mtcars dataset:

library(ggplot2)
library(patchwork)
p1 <- ggplot(mtcars, aes(hp, mpg)) +           
  geom_point() +
  ggtitle("title 1")
p2 <- ggplot(mtcars, aes(qsec)) +
  geom_density() +
  ggtitle("title 2")
p3 <- ggplot(mtcars, aes(wt)) +
  geom_histogram() +
  ggtitle("title 3")
p4 <- ggplot(mtcars, aes(cyl, carb)) +
  geom_bar(stat = "identity") +
  ggtitle("title 4")

p_all <- (p1 + p2) / (p3 + p4) +    
  plot_annotation(title = "Main title of Multiplot") & 
  theme(plot.title = element_text(hjust = 0.5))

p_all 

Created on 2022-08-19 with reprex v2.0.2

Quinten
  • 35,235
  • 5
  • 20
  • 53