What alternatives are there to pylab for plotting in Python? In particular, I'm looking for something that doesn't use the stateful model that pylab does.
Asked
Active
Viewed 6.9k times
8 Answers
48
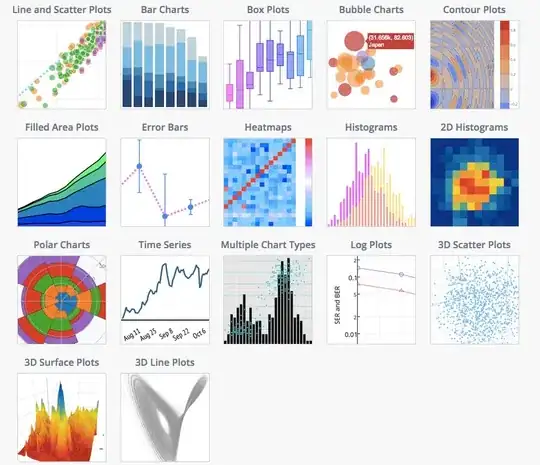
Plotly lets you make graphs using a Python API, matplotlib, and pandas. Their IPython gallery has some example scientific graphs with the Python scripts that generated them.
Here's a sample:
Some recent exciting open source offerings:
- ggplot is based on R's ggplot2, with aesthetically pleasing defaults and a really concise api. wants to be a matplotlib killer
- bokeh makes interactive (html canvas) plots. emphasis on interativity + handling big data
- vega translates JSON "plot descriptions" into SVG or Canvas-based interactive plots, and vincent is a declarative interface for generating the JSON specifications.
(source: fastly.net)
Glorfindel
- 21,988
- 13
- 81
- 109
james howard
- 1
- 2
- 2
-
7ggplot isn't trying to be a matplotlib killer...in fact it is a matplotlib wrapper. – Julian Irwin Mar 26 '15 at 15:14
-
I wouldn't recommend Bokeh. Tried it and it renders into a browser. In my opinion, that's lame. Should've just rendered it into it's own window. Besides, the plot didn't show up on Firefox and Chromium. – Nav Dec 08 '19 at 12:22
28
You can always use the object-oriented framework for Matplotlib instead of the pylab interface.
Peter Mortensen
- 30,738
- 21
- 105
- 131
Autoplectic
- 7,566
- 30
- 30
3
I was in need of gnuplot interface for Python 3 but have found nothing. So I have ported Gnuplot.py to it. See more info in the 'readme' of the [repository]. Hope this will help someone else in future.
oblalex
- 5,366
- 2
- 24
- 25
2
There is also a old program for automating the reading, filtering, processing, interpolation and plot n-dimensional values from different sources (like libreOffice- or csv-files) and variable size: diaGrabber.
You have to use some simple python-commands to create a case. After this you can manipulate the graphical output in an interactive GUI.
Dev2rights
- 3,469
- 3
- 25
- 42
karlB
- 4,261
- 1
- 12
- 5
1
-
pyla-gplot is a small stand alone single python script works with python 3 and above and Gnu plot. – atronoush Sep 08 '10 at 10:30
-
to get gplot from pyla visit http://pyla.codeplex.com/; It needs Python 3 and Gnuplot 4.0 and above. Gnuplot.py by this date is not compatible with Python 3.x – atronoush Sep 08 '10 at 10:32