5

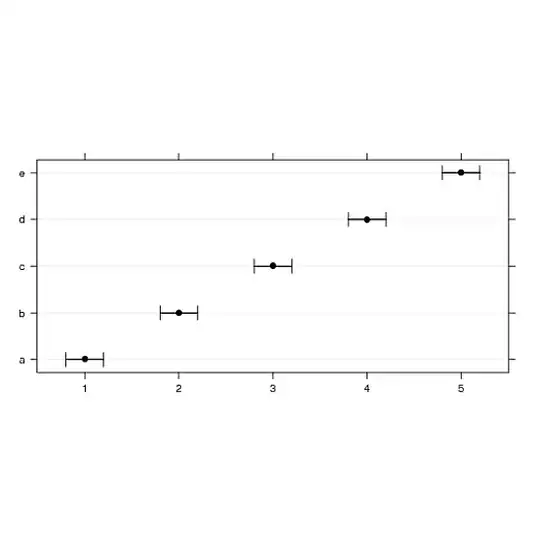
I am drawing dotplot() using lattice or Dotplot() using Hmisc. When I use default parameters, I can plot error bars without small vertical endings

--o--

but I would like to get

|--o--|

I know I can get

|--o--|

when I use centipede.plot() from plotrix or segplot() from latticeExtra, but those solutions don't give me such nice conditioning options as Dotplot(). I was trying to play with par.settings of plot.line, which works well for changing error bar line color, width, etc., but so far I've been unsuccessful in adding the vertical endings:

require(Hmisc)
mean = c(1:5)
lo = mean-0.2
up = mean+0.2
d = data.frame (name = c("a","b","c","d","e"), mean, lo, up)
Dotplot(name ~ Cbind(mean,lo,up),data=d,ylab="",xlab="",col=1,cex=1,
        par.settings = list(plot.line=list(col=1),
                       layout.heights=list(bottom.padding=20,top.padding=20)))

enter image description here

Please, don't give me solutions that use ggplot2...

Geek On Acid
  • 6,330
  • 4
  • 44
  • 64
  • A starting point could be to use `bwplot` and modify the panel, i.e. `panel.bwplot`. – Andrie Feb 27 '12 at 16:31
  • The following threads might be helpful. http://r.789695.n4.nabble.com/dotplots-with-error-bars-td4382474.html http://tolstoy.newcastle.edu.au/R/e2/help/06/10/2791.html – Carl Witthoft Feb 27 '12 at 17:06

1 Answers1

6

I've had this same need in the past, with barchart() instead of with Dotplot().

My solution then was to create a customized panel function that: (1) first executes the original panel function ; and (2) then uses panel.arrows() to add the error bar (using a two-headed arrow, in which the edges of the head form a 90 degree angle with the shaft).

Here's what that might look like with Dotplot():

# Create the customized panel function
mypanel.Dotplot <- function(x, y, ...) {
    panel.Dotplot(x,y,...)
        tips <- attr(x, "other")
        panel.arrows(x0 = tips[,1], y0 = y, 
                     x1 = tips[,2], y1 = y, 
                     length = 0.15, unit = "native",
                     angle = 90, code = 3)
}

# Use almost the same call as before, replacing the default panel function 
# with your customized function.
Dotplot(name ~ Cbind(mean,lo,up),data=d,ylab="",xlab="",col=1,cex=1,
        panel = mypanel.Dotplot,
        par.settings = list(plot.line=list(col=1),
                       layout.heights=list(bottom.padding=20,top.padding=20)))

enter image description here

Josh O'Brien
  • 159,210
  • 26
  • 366
  • 455
  • Nice one! I thought that those panel functions can do magic, but lattice manual isn't straightforward and there are lots of approaches one can take to change parameters. Cheers mate! – Geek On Acid Feb 27 '12 at 18:25
  • Hmm now I have problem with it because it doesn't work when I apply two more condition. See that by adding another two condition: `Dotplot(name ~ Cbind(mean,lo,up) | condX * condY,...)`. Any ideas? – Geek On Acid Feb 28 '12 at 16:54
  • @GeekOnAcid -- I've got no time right now. What I'd suggest is for you to put a line reading `browser()` inside of the customized panel function (first line would do). Then, when/if that panel function is called, it'll interrupt execution, and you can poke around in there, to see if, for instance, `tips <- attr(x, "other")` still extracts the correct data. (If you were using `groups=` rather than conditioning (via the `|`), I'd say you might need to deal with the whole `panel.superpose()` morass, but I *believe* that that probably isn't the issue here. – Josh O'Brien Feb 28 '12 at 17:20
  • @GeekOnAcid -- Then, if you can't figure it out, maybe either edit this question, or ask it as a new question. If someone else doesn't pick it up, I'll come back to this when I have a chance. Best of luck! – Josh O'Brien Feb 28 '12 at 17:22
  • +1 the same basic idea occurred to me (custom panel functions are usually the answer) but I couldn't see how/where the information for the error bars was passed on. Your answer covers this nicely, thanks! – Gavin Simpson Feb 28 '12 at 20:47