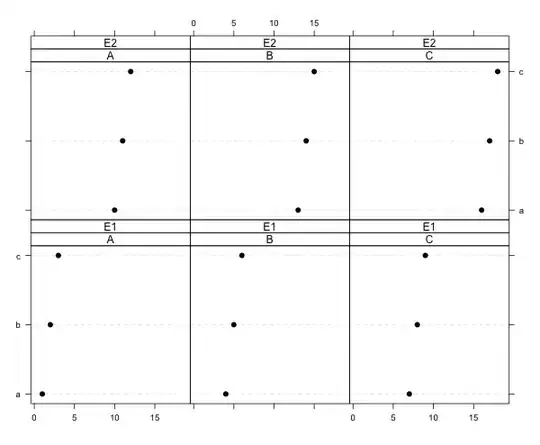
This question is an unexpected follow-up from Draw vertical ending of error bar line in dotplot. While the quoted question was succesfully resolved - there is a caveat. When I introduce more then three conditions to dotplot it doesn't want to draw the vertical ticks |--o--| in the endings of error bars.
As @Josh suggested in the comments, I injected browser() into first line of function that draws updated panel.Dotplot to see what goes wrong, but it didn't come out with anything that helps me to solve it. Here is an example code for four-conditions Dotplot() with updated panel.Dotplot function that doesn't work. It will work, if you decrease number of conditions (check answer for the question quoted above):
require(Hmisc)
#Fake conditions
mean = c(1:18)
lo = mean-0.2
up = mean+0.2
name = c("a","b","c")
cond1 = c("A","B","C")
cond2 = c(rep("E1",9),rep("E2",9))
d = data.frame (name = rep(name,6), mean, lo, up,
                cond1=rep(cond1,each=3,times=2), cond2)
# Create the customized panel function
mypanel.Dotplot <- function(x, y, ...) {
       panel.Dotplot(x,y,...)
       tips <- attr(x, "other")
       panel.arrows(x0 = tips[,1], y0 = y,x1 = tips[,2],
                y1 = y,length = 0.1, unit = "native",
                angle = 90, code = 3)
}
#Draw Dotplot - `panel.Dotplot` doesn't change anything
setTrellis()
Dotplot(name ~ Cbind(mean,lo,up) | cond1 * cond2, data=d, ylab="", xlab="",col=1,
        panel = mypanel.Dotplot)