22

I want to plot a world map using ggplot2 (v.9) which combines two pieces if information. The following example illustrates:

library(rgdal)
library(ggplot2)
library(maptools)

# Data from http://thematicmapping.org/downloads/world_borders.php.
# Direct link: http://thematicmapping.org/downloads/TM_WORLD_BORDERS_SIMPL-0.3.zip
# Unpack and put the files in a dir 'data'

gpclibPermit()
world.map <- readOGR(dsn="data", layer="TM_WORLD_BORDERS_SIMPL-0.3")
world.ggmap <- fortify(world.map, region = "NAME")

n <- length(unique(world.ggmap$id))
df <- data.frame(id = unique(world.ggmap$id),
                 growth = 4*runif(n),
                 category = factor(sample(1:5, n, replace=T)))

## noise
df[c(sample(1:100,40)),c("growth", "category")] <- NA


ggplot(df, aes(map_id = id)) +
     geom_map(aes(fill = growth, color = category), map =world.ggmap) +
     expand_limits(x = world.ggmap$long, y = world.ggmap$lat) +
     scale_fill_gradient(low = "red", high = "blue", guide = "colorbar")

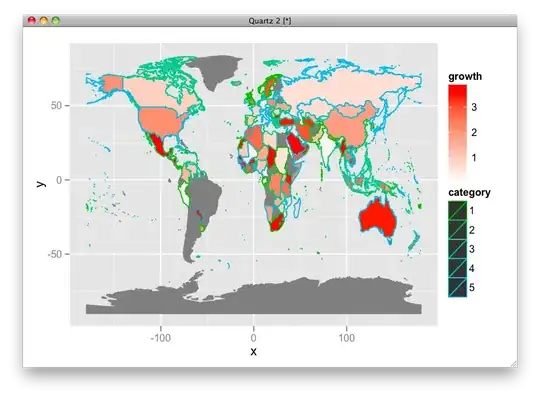
However, this solution is not a nice way to display both growth and category. Growth is highly visible, but category is almost impossible to see because it is just a border.

I have tried to increase the size of borders, but without luck (the new geom_map is hard to work with). Does anyone knows how to increase border size in the above example, or even better, a mechanism to display two factors?

A bonus question: country names, such as those used by the maps package (which features USSR!) are the data used in the example is fragile. I prefer to use ISO 3166-1 alpha-3(1). Does anyone know data readily usable with ggplot2 which features ISO-... country names (included in linked data)

Result:

result http://ompldr.org/vY3hsYQ

Rasmus
  • 1,349
  • 1
  • 9
  • 15
  • what is world.map? it is not defined in your code. If I try fortify(w,region="NAME"), I get an 'invalid multibyte character' error. Please provide reproducible code. – Ian Fellows Mar 04 '12 at 20:03
  • I get the following error on the fortify line: "Error in nchar(ID) : invalid multibyte string 1" – Ian Fellows Mar 04 '12 at 22:12
  • I cannot reproduce on a UTF8 system; I suspect font encoding is a problem here. iconv(.) can convert from one coding system to another. – Rasmus Mar 04 '12 at 22:27

2 Answers2

13

I would use different hue ranges for fill and line color:

ggplot(df, aes(map_id = id)) +
  geom_map(aes(fill = growth, color = category), map =world.ggmap) +
  expand_limits(x = world.ggmap$long, y = world.ggmap$lat) +
  scale_fill_gradient(high = "red", low = "white", guide = "colorbar") +
  scale_colour_hue(h = c(120, 240))

enter image description here

OR, use fill for category and transparency for growth level.

ggplot(df, aes(map_id = id)) +
  geom_map(aes(alpha = growth, fill = category), map =world.ggmap) +
  expand_limits(x = world.ggmap$long, y = world.ggmap$lat) +
  scale_alpha(range = c(0.2, 1), na.value = 1)

enter image description here

It depends on what you want to show.

Just in case, here is the way to change the linesize:

ggplot(df, aes(map_id = id)) +
 geom_map(aes(fill = growth, color = category, size = factor(1)), map =world.ggmap) +
 expand_limits(x = world.ggmap$long, y = world.ggmap$lat) +
 scale_fill_gradient(high = "red", low = "white", guide = "colorbar") +
 scale_colour_hue(h = c(120, 240)) + 
 scale_size_manual(values = 2, guide = FALSE)

enter image description here

Here is HSV version:

df$hue <- ifelse(is.na(df$category), 0, as.numeric(df$category)/max(as.numeric(df$category), na.rm=T))
df$sat <- ifelse(is.na(df$growth), 0, df$growth/max(df$growth, na.rm=T))
df$fill <- ifelse(is.na(df$category), "grey50", hsv(df$hue, df$sat))

ggplot(df, aes(map_id = id)) +
 geom_map(aes(fill = fill), map =world.ggmap) +
 expand_limits(x = world.ggmap$long, y = world.ggmap$lat) +
 scale_fill_identity(guide = "none")

enter image description here

kohske
  • 65,572
  • 8
  • 165
  • 155
  • 1
    Thanks! The problem is getting the line `thick enough' to be noticeable, even if the graphic is printed small. – Rasmus Mar 04 '12 at 22:28
  • 1
    I think you are asking too much. I don't think it is possible to show so much information with a small paper. – kohske Mar 04 '12 at 22:33
  • You can find the way to change the linesize, but actually I don't think this is useful... – kohske Mar 04 '12 at 22:38
  • The alpha-proposal is very nice! Thanks. It made me think, the best way to illustrate it might be to set one base-color for each category, and then determine the saturation as a function of growth. This is more or less what alpha does, especially if one uses the blank theme (or specifically set bg to white). Is there, to your knowledge, a more direct way to get this result than your alpha approach? – Rasmus Mar 04 '12 at 23:08
  • 1
    Combination of hue and saturation is good, I think. Future version of ggplot2 may have such function, i.e., hue, saturation, and value as separate aes. Anyway you can do that by manual setting. I will post updates. – kohske Mar 04 '12 at 23:11
  • You can find HSV version. One problem is that automatic guide legends cannot work with manual HSV. – kohske Mar 04 '12 at 23:24
  • The HSV version is quite cool. I guess one somehow hack a legend together using the original category factor. As a dirty trick aes(color = category) would be rather innocent and (probably) result in something desirable. – Rasmus Mar 05 '12 at 00:10
  • @kohske If interested, I just asked a related question (using same example) here: http://stackoverflow.com/questions/13219387/world-map-map-halves-of-countries-to-different-colors – Xu Wang Nov 05 '12 at 01:57
9

One option is to map growth to the size of some points plotted at the centroid of the polygons.

centroids <- as.data.frame(coordinates(world.map))
df <- data.frame(df,centroids)

choropleth <-ggplot() +
     geom_map(aes(fill = category, map_id = id),data = df, map =world.ggmap) +
     expand_limits(x = world.ggmap$long, y = world.ggmap$lat) + 
    scale_fill_hue(na.value=NA)
choropleth


choropleth + geom_point(aes(x=V1,y=V2,size=growth),data=df) +
    scale_area(range=c(0,3))

enter image description here

Or if you really want to double code color, you could color the points instead. Note, that you can also add a raster map of satellite imagery with the new OpenStreetMap package (shameless plug).

library(OpenStreetMap)
library(raster)
rastermap <- openmap(c(70,-179),
        c(-70,179),zoom=2,type='bing')
rastermap <- openproj(rastermap)
autoplot(rastermap,expand=FALSE) +
     geom_map(aes(x=70,y=70,fill = category, map_id = id),data = df,
        map =world.ggmap) +
     expand_limits(x = world.ggmap$long, y = world.ggmap$lat) + 
    scale_fill_hue(na.value=NA) + 
    geom_point(aes(x=V1,y=V2,colour=growth),data=df) +
    scale_colour_gradient(low = "red", high = "blue", 
        guide = "colorbar",na.value=NA)

enter image description here

Ian Fellows
  • 17,228
  • 10
  • 49
  • 63
  • Ian, your package looks nice![1] it does add a nice touch. Adding an alpha(ed)-fill would probably look very cool. BTW: Are you aware of the ggmap package? Based on the abstract they sound similar. The point idea is a great idea. By using a star or something that looks less link an ink stink this could be turned into something nice. Thanks! – Rasmus Mar 05 '12 at 00:00
  • I am aware of the package. OpenStreetMap is basically a replacement for both RGoogleMaps and ggmap. It does cool things like tile caching and map projection transformations. – Ian Fellows Mar 05 '12 at 01:17
  • @IanFellows If interested, I just asked a related question (using same example) here: http://stackoverflow.com/questions/13219387/world-map-map-halves-of-countries-to-different-colors – Xu Wang Nov 05 '12 at 01:58