Does anyone know if is there any way to change the Y axis limits on a line chart from D3?
I'm using the last version from Codeplex source... The WPF one, not the Silverlight version.
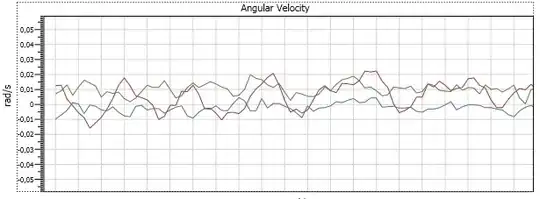
I'm plotting readings from Android sensors and the range values change quite a bit. Sometimes it's around zero and the graph looks like this:
Then the magnitude of the values changes and the Y axis is rescaled to show the entire data and the graph now looks like this:

See how the Y values changed a lot from Picture 1 to 2.
What I want is to make the Y axis with fixed values that I choose, lets say -10 to +10. Then the graph will be plot always with the same scale.
Is there any way to do that?
The XAML code for the graph is this:
    <d3:ChartPlotter
        Name="gyroGraph"
        Margin="21,5,10,0"
        Grid.ColumnSpan="2"
        Background="White"
        Grid.Row="1"
        LegendVisibility="Collapsed"
        NewLegendVisible="False"
        MainHorizontalAxisVisibility="Collapsed"
        MainVerticalAxisVisibility="Collapsed">
        <d3:VerticalAxis
            FontSize="8" />
        <d3:Header
            Content="Angular Velocity"
            FontSize="11" />
    </d3:ChartPlotter>
Thanks and best regards, Rodrigo Basniak