25

Is it possible to get a line number for the source code (or anything that helps debug where the problem is) from the debugger, that shows where the problem is originating?

I am getting an error:

-[NSCFArray objectAtIndex:]: index (-1 (or possibly larger)) beyond bounds (9)

which obviously means that I am going out of bounds at some point, however if it possible I would like to get some more information to help me solve the problem.

I am placing a breakpoint and trying to go through the program line by line but it is a tedious process. Thanks!

Mike Weller
  • 45,401
  • 15
  • 131
  • 151
Kevin
  • 1,469
  • 2
  • 19
  • 28

2 Answers2

84

When the debugger stops, go to the "Debug Navigator" and make sure the slider on the bottom is all the way to the right.

Scan your eye down from the point at which the exception is thrown and you should eventually come to your own code. Click on the appropriate method/function name and the code will be opened in the editor.

enter image description here

enter image description here

If you don't see any of your own methods in the stack trace, the exception may have been passed through a performSelector-style call in which case the stack trace is gone. If this is the case, you may get better information by adding an "On Throw" exception break point. First switch to the "Breakpoint navigator":

enter image description here

Then click on the plus and choose "Add Exception breakpoint..."

enter image description here

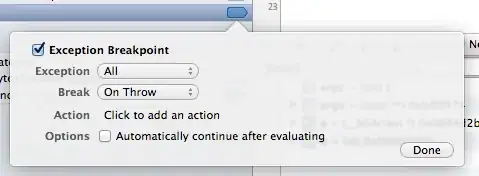
Create an "On Throw" break point:

enter image description here

This will stop the debugger at the exact point the exception is thrown, and you get a better stack trace. It's a good idea to have an exception break point like this enabled all the time, although you will occasionally get internal exceptions from Apple code (e.g. when using QLPreviewController, MPMoviePlayerController).

Mike Weller
  • 45,401
  • 15
  • 131
  • 151
  • Sweet! Thanks a lot Mike! Is there something similar in Xcode 3.x ? I use Xcode 4.3 at home but at work it's still Xcode 3. Once again thanks. – Kevin May 08 '12 at 15:25
  • Tell my boss that! Thanks for your help Mike. – Kevin May 09 '12 at 08:20
  • And I'm afraid I can't remember the exact details with Xcode 3. There's a keyboard shortcut to open the debug window. Maybe Shift+Apple+Y or Shift+Apple+D. You'll have to hunt around to find it in the menu. – Mike Weller May 09 '12 at 08:24
  • @Mike its very helpful.Can u also share how to remove runtime breakpoints that we added using ur answer. – Swastik Jul 23 '12 at 06:02
  • Click the blue breakpoint graphic to toggle it, or select it and hit delete. – Mike Weller Jul 24 '12 at 07:33
  • Awesome. This helped a great deal – trivektor Feb 10 '13 at 09:34
  • Definitely one of the most useful things Ive read on Stackoverflow. Shows how little I know about debugging...thanks a load. Fixed my bug in like 2 minutes after reading this. – Arbel Jun 08 '13 at 09:28
  • OMG why do all projects not come with an OnThrow type breakpoint already enabled? This would have saved me so much time! How did I not already know about this?! – CommaToast Jul 14 '16 at 00:46
10

You should also consider using the NSSetUncaughtExceptionHandler. (You can save the crash log to the disk, check next startup if a new crash log was saved, attach it to an email, etc.)

put this into your didFinishLaunchingWithOptions method:

NSSetUncaughtExceptionHandler(&exceptionHandler);

and implement your exception handler:

void exceptionHandler(NSException *exception)
{        
    NSLog(@"%@",[exception name]);
    NSLog(@"%@",[exception reason]);
    NSLog(@"%@",[exception userInfo]);
    NSLog(@"%@",[exception callStackSymbols]);
    NSLog(@"%@",[exception callStackReturnAddresses]);
}
Dávid Kaszás
  • 1,877
  • 1
  • 16
  • 20
  • Thank you so much, this will help me for my product. do you have any idea how crashlytics handling crashed. I planning to build my own sdk As we have 200 project and very huge end user. – Mohammad Parvez May 16 '20 at 15:04