1

I have seen some questions asked about step functions in matplotlib but this one is different. Here is my function:

def JerkFunction(listOfJerk):
    '''Return the plot of a sequence of jerk'''
    #initialization of the jerk
    x = np.linspace(0,5,4)
    y = listOfJerk #step signal

    plt.axis([0,5,-2,2])
    plt.step(x,y,'y') #step display
    plt.xlabel('Time (s)')
    plt.ylabel('Jerk (m/s^3)')

    plt.title('Jerk produced by the engine')

    return plt.show()

I would like to have the curve obtained when I put JerkFunction([1,1,-1,1]) but by entering: [1,-1,1,-1], indeed, at the beginning, in a real case, the jerk value is 0 and at t=0, it becomes jerk=+1, then at t=1 it is Jerk=-1 etc.
Vertexwahn
  • 7,709
  • 6
  • 64
  • 90
Ponzi
  • 29
  • 1
  • 2
  • 4
  • 1
    I'm not really sure what you are trying to do. Could you clarify your question? – Matt Oct 11 '12 at 14:53
  • What is your problem? I see a description of the result, but there doesn't seem to be any problem. What are your expectations (eg, for particular use case), what are the actual results? –  Oct 11 '12 at 15:07
  • Your `JerkFunction()` doesn't actually do anything, and unless this entire block of code is in a function, your `return plt.show()` is a syntax error. – Matt Oct 11 '12 at 16:01
  • Did you get this sorted out? – tacaswell Oct 05 '13 at 00:39
  • Note that the documentation states: **y**: array like 1-D sequence, and it is assumed, but not checked, that it is uniformly increasing. – H. Vabri May 19 '17 at 11:31

2 Answers2

5

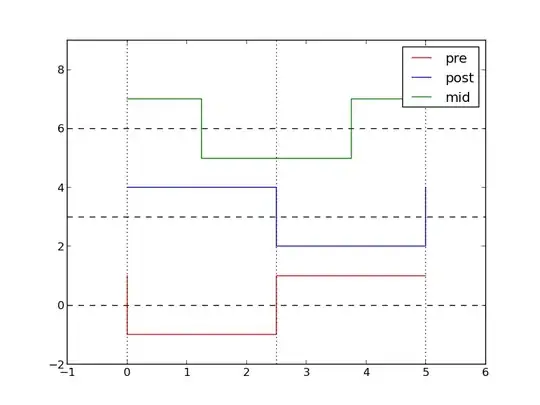
I think you are having the same problem this question Matlibplot step function index 0. The issue you are having is related to where step changes the value in relation to the x values (doc).

The following demonstrates the three ways it can do this. The curves are shifted vertically for clarity. The horizontal dashed lines are 'zero' and the vertical dotted lines are your x values.

x = np.linspace(0,5,3)
y = np.array([1,-1,1])

fig = plt.figure()
ax = fig.add_subplot(111)
ax.step(x,y,color='r',label='pre')
ax.step(x,y+3,color='b',label='post',where='post')
ax.step(x,y+6,color='g',label='mid',where='mid')
for j in [0,3,6]:
    ax.axhline(j,color='k',linestyle='--')
for j in x:
    ax.axvline(j,color='k',linestyle=':')
ax.set_ylim([-2,9])
ax.set_xlim([-1,6])
ax.legend()

ax.draw()

example of three step location options

Community
  • 1
  • 1
tacaswell
  • 84,579
  • 22
  • 210
  • 199
  • Yeah it is the blue curve that I needed, tks you. I now have my step function and its integrate signal, a triangle function.Any idea of how I can integrate my triangle function? cause I see some function predifined in scipy but it return numbers and I want a curve, more exactly parabolas. – Ponzi Oct 12 '12 at 08:05
  • 1
    @Ponzi If this answered your question, you should accept this answer and then ask a new question about how to integrate the triangle function. – tacaswell Oct 12 '12 at 15:43
0

It's not clear exactly what you're trying to do, but I think this may produce the plot you are looking for. If this is not what you are looking for it will be easier to assist you with more information.

import numpy as np
import matplotlib.pyplot as plt

x = np.linspace(0,5,4)
y = [1,1,-1,1]

fig = plt.figure()
ax = fig.add_subplot(111)
ax.step(x,y)
ax.set_xlabel('Time (s)')
ax.set_ylabel(r'Jerk ($m/s^3$)')
ax.set_ylim((-1.5,1.5))
ax.set_title('Jerk Produced by the Engine')

plt.show()

Example Plot

Mr. Squig
  • 2,755
  • 17
  • 10