18

I'm doing some 3D surface plots using Matplotlib in Python and have noticed an annoying phenomenon. Depending on how I set the viewpoint (camera location), the vertical (z) axis moves between the left and right side. Here are two examples: Example 1, Axis left, Example 2, Axis right. The first example has ax.view_init(25,-135) while the second has ax.view_init(25,-45).

I would like to keep the viewpoints the same (best way to view the data). Is there any way to force the axis to one side or the other?

Trenton McKinney
  • 56,955
  • 33
  • 144
  • 158
Blink
  • 1,444
  • 5
  • 17
  • 25

2 Answers2

15

I needed something similar: drawing the zaxis on both sides. Thanks to the answer by @crayzeewulf I came to following workaround (for left, righ, or both sides):
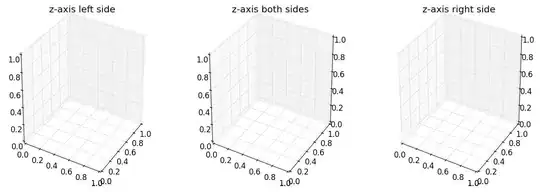
enter image description here

First plot your 3d as you need, then before you call show() wrap the Axes3D with a Wrapper class that simply overrides the draw() method.

The Wrapper Class calls simply sets the visibility of some features to False, it draws itself and finally draws the zaxis with modified PLANES. This Wrapper Class allows you to draw the zaxis on the left, on the rigth or on both sides.

import matplotlib
matplotlib.use('QT4Agg')
import matplotlib.pyplot as plt
from mpl_toolkits.mplot3d import axes3d

class MyAxes3D(axes3d.Axes3D):

    def __init__(self, baseObject, sides_to_draw):
        self.__class__ = type(baseObject.__class__.__name__,
                              (self.__class__, baseObject.__class__),
                              {})
        self.__dict__ = baseObject.__dict__
        self.sides_to_draw = list(sides_to_draw)
        self.mouse_init()

    def set_some_features_visibility(self, visible):
        for t in self.w_zaxis.get_ticklines() + self.w_zaxis.get_ticklabels():
            t.set_visible(visible)
        self.w_zaxis.line.set_visible(visible)
        self.w_zaxis.pane.set_visible(visible)
        self.w_zaxis.label.set_visible(visible)

    def draw(self, renderer):
        # set visibility of some features False 
        self.set_some_features_visibility(False)
        # draw the axes
        super(MyAxes3D, self).draw(renderer)
        # set visibility of some features True. 
        # This could be adapted to set your features to desired visibility, 
        # e.g. storing the previous values and restoring the values
        self.set_some_features_visibility(True)

        zaxis = self.zaxis
        draw_grid_old = zaxis.axes._draw_grid
        # disable draw grid
        zaxis.axes._draw_grid = False

        tmp_planes = zaxis._PLANES

        if 'l' in self.sides_to_draw :
            # draw zaxis on the left side
            zaxis._PLANES = (tmp_planes[2], tmp_planes[3],
                             tmp_planes[0], tmp_planes[1],
                             tmp_planes[4], tmp_planes[5])
            zaxis.draw(renderer)
        if 'r' in self.sides_to_draw :
            # draw zaxis on the right side
            zaxis._PLANES = (tmp_planes[3], tmp_planes[2], 
                             tmp_planes[1], tmp_planes[0], 
                             tmp_planes[4], tmp_planes[5])
            zaxis.draw(renderer)

        zaxis._PLANES = tmp_planes

        # disable draw grid
        zaxis.axes._draw_grid = draw_grid_old

def example_surface(ax):
    """ draw an example surface. code borrowed from http://matplotlib.org/examples/mplot3d/surface3d_demo.html """
    from matplotlib import cm
    import numpy as np
    X = np.arange(-5, 5, 0.25)
    Y = np.arange(-5, 5, 0.25)
    X, Y = np.meshgrid(X, Y)
    R = np.sqrt(X**2 + Y**2)
    Z = np.sin(R)
    surf = ax.plot_surface(X, Y, Z, rstride=1, cstride=1, cmap=cm.coolwarm, linewidth=0, antialiased=False)

if __name__ == '__main__':
    fig = plt.figure(figsize=(15, 5))
    ax = fig.add_subplot(131, projection='3d')
    ax.set_title('z-axis left side')
    ax = fig.add_axes(MyAxes3D(ax, 'l'))
    example_surface(ax) # draw an example surface
    ax = fig.add_subplot(132, projection='3d')
    ax.set_title('z-axis both sides')
    ax = fig.add_axes(MyAxes3D(ax, 'lr'))
    example_surface(ax) # draw an example surface
    ax = fig.add_subplot(133, projection='3d')
    ax.set_title('z-axis right side')
    ax = fig.add_axes(MyAxes3D(ax, 'r'))
    example_surface(ax) # draw an example surface
    plt.show()
wolfrevo
  • 6,651
  • 2
  • 26
  • 38
  • Could you please update the example with an actual surface? I am having trouble getting this to work. – pyCthon May 08 '15 at 18:25
  • 1
    Here's what I get when I add a plot after you set `fig` http://imgur.com/VJLTTTH – pyCthon May 08 '15 at 18:32
  • 1
    @pyCthon: see my update of the example. I've simple added a function to draw a surface with code borrowed from http://matplotlib.org/examples/mplot3d/surface3d_demo.html. – wolfrevo May 10 '15 at 18:08
  • 2
    similar effect with hacking `ax.zaxis._axinfo['juggled'] = (0,2,1)` described at https://stackoverflow.com/a/49601745/1149007 – sherdim Oct 26 '18 at 14:02
11

As pointed out in a comment below by OP, the method suggested below did not provide adequate answer to the original question.

As mentioned in this note, there are lots of hard-coded values in axis3d that make it difficult to customize its behavior. So, I do not think there is a good way to do this in the current API. You can "hack" it by modifying the _PLANES parameter of the zaxis as shown below:

tmp_planes = ax.zaxis._PLANES 
ax.zaxis._PLANES = ( tmp_planes[2], tmp_planes[3], 
                     tmp_planes[0], tmp_planes[1], 
                     tmp_planes[4], tmp_planes[5])
view_1 = (25, -135)
view_2 = (25, -45)
init_view = view_2
ax.view_init(*init_view)

Now the z-axis will always be on the left side of the figure no matter how you rotate the figure (as long as positive-z direction is pointing up). The x-axis and y-axis will keep flipping though. You can play with _PLANES and might be able to get the desired behavior for all axes but this is likely to break in future versions of matplotlib.

crayzeewulf
  • 5,840
  • 1
  • 27
  • 30
  • Thank you very much crayzeewulf. It's a little weird, I was able to get it to work, however, it doesn't behave as expected. When I run the script without your modification, the z-axis was on the left. When I implemented your modification, the z-axis stayed on the left. I changed the order of ax.zaxis._PLANES=(tmp[0],tmp[1],tmp[2],tmp[3],tmp[4],tmp[5]) and it moved the axis to the right side (what I wanted). It seems that I just reset the same values of ax.zaxis._PLANES but it achieves different results. Anyway, thanks again, this is *exactly* what I wanted, I appreciate it. – Blink Feb 24 '13 at 20:44
  • Woops, I was mistaken. To change the axis I used ax.zaxis._PLANES=(tmp[1],tmp[2],tmp[3],tmp[4],tmp[5],tmp[0]). This worked; however, I just realized that it also shifts the horizontal/vertical lines on the planes. You can see [here](http://i.imagebanana.com/img/vpcs6af2/Selection_005.png) that the back axis planes have no horizontal lines but the front ones do. Is there any website describing how ._PLANES is defined? I've tried putting about 50 different combinations into it to figure it out but I haven't been able to get the result I want (vertical axis on right side and horz. lines on back) – Blink Feb 24 '13 at 21:57
  • 1
    Following up my last comment. I just completed a brute force test running through all permutations of [0,1,2,3,4,5] for the tmp_planes, a total of 720 different arrangements. **None** of them resulted in the proper figure. I guess I may just be stuck with the problem. – Blink Feb 25 '13 at 05:31
  • William, I am sorry that none of the permutations worked to keep the z-axis on the right side without messing up some other feature of the plot. Messing with `_PLANES` is truely an ugly kludge. The mechanism for determining the position of the axes is implemented in the file named `axis3d.py` of `matplotlib`. You can see from this code that it is not very flexible at the moment but you might be able to learn more about the way `_PLANES` is used from reading this file. You might be able to Monkey patch the `Axis` class in this file to get it working the way you want. But again this is ugly. – crayzeewulf Feb 25 '13 at 17:11
  • 1
    @crayzeewulf: thanks to the idea with the PLANES. After learning something about how they work. I've posted a workaround that do not mess up the other features and avoids patching the sources. – wolfrevo Aug 01 '14 at 15:18