6

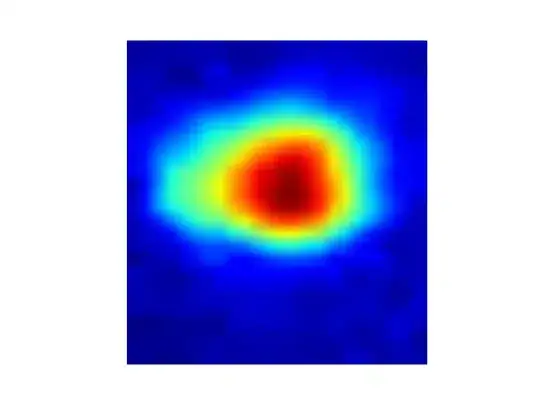
I have a series of basic 2D images (3 for simplicity for now) and these are related to each other, analogous to frames from a movie:

Within python how may I stack these slices on top of each other, as in image1->image2->image-3? I'm using pylab to display these images. Ideally an isometric view of the stacked frames would be good or a tool allowing me to rotate the view within code/in rendered image.

Any assistance appreciated. Code and images shown:

from PIL import Image
import pylab
  
fileName = "image1.png"
im = Image.open(fileName)
pylab.axis('off')
pylab.imshow(im)
pylab.show()

Image1.png here Image2.png here Image3.png here

Community
  • 1
  • 1
Harry Lime
  • 2,167
  • 8
  • 31
  • 53
  • You should also look into `mayavi`, which does native opengl rendering and has much better tools for 3D visualizations. – tacaswell Mar 30 '13 at 23:55

3 Answers3

11

You can't do this with imshow, but you can with contourf, if that will work for you. It's a bit of a kludge though:

enter image description here

from mpl_toolkits.mplot3d import Axes3D
import numpy as np
import matplotlib.pyplot as plt

fig = plt.figure()
ax = fig.gca(projection='3d')

x = np.linspace(0, 1, 100)
X, Y = np.meshgrid(x, x)
Z = np.sin(X)*np.sin(Y)

levels = np.linspace(-1, 1, 40)

ax.contourf(X, Y, .1*np.sin(3*X)*np.sin(5*Y), zdir='z', levels=.1*levels)
ax.contourf(X, Y, 3+.1*np.sin(5*X)*np.sin(8*Y), zdir='z', levels=3+.1*levels)
ax.contourf(X, Y, 7+.1*np.sin(7*X)*np.sin(3*Y), zdir='z', levels=7+.1*levels)

ax.legend()
ax.set_xlim3d(0, 1)
ax.set_ylim3d(0, 1)
ax.set_zlim3d(0, 10)

plt.show()

The docs of what's implemented in 3D are here.

As ali_m suggested, if this won't work for you, if you can imagine it you can do it with VTk/MayaVi.

tom10
  • 67,082
  • 10
  • 127
  • 137
  • tom10, this code works fine for functions, I'm unable to get this to work for image data (I'm coming from a Matlab background). Advice welcome. – Harry Lime Mar 24 '13 at 18:05
  • 2
    You need to understand the difference between a contour plot and an image. The plots you show are clearly false color images of some single value using the jet colormap. Instead of plotting the false color images from the z-values, make a contour plot from the z-values. – tom10 Mar 24 '13 at 18:55
4

As far as I know, matplotlib has no 3D equivalent to imshow that would allow you to draw a 2D array as a plane within 3D axes. However, mayavi seems to have exactly the function you're looking for.

ali_m
  • 71,714
  • 23
  • 223
  • 298
  • How does the stacking work with mayavi.mlab.imshow? I.e. how do you put false color images on top of each other? – Matthias Apr 06 '16 at 15:36
  • 1
    See http://stackoverflow.com/q/17406954/1461210 and http://stackoverflow.com/q/19349904/1461210 – ali_m Apr 06 '16 at 15:43
4

Here is a completely silly way to accomplish using matplotlib and shear transformations (you probably need to tweak the transform matrix some more so the stacked images look correct):

import numpy as np
import matplotlib.pyplot as plt

from scipy.ndimage.interpolation import affine_transform


nimages = 4
img_height, img_width = 512, 512
bg_val = -1 # Some flag value indicating the background.

# Random test images.
rs = np.random.RandomState(123)
img = rs.randn(img_height, img_width)*0.1
images = [img+(i+1) for i in range(nimages)]

stacked_height = 2*img_height
stacked_width  = img_width + (nimages-1)*img_width/2
stacked = np.full((stacked_height, stacked_width), bg_val)

# Affine transform matrix.
T = np.array([[1,-1],
              [0, 1]])

for i in range(nimages):
    # The first image will be right most and on the "bottom" of the stack.
    o = (nimages-i-1) * img_width/2
    out = affine_transform(images[i], T, offset=[o,-o],
                           output_shape=stacked.shape, cval=bg_val)
    stacked[out != bg_val] = out[out != bg_val]

plt.imshow(stacked, cmap=plt.cm.viridis)
plt.show()

shear transform stack

Matt Hancock
  • 3,870
  • 4
  • 30
  • 44