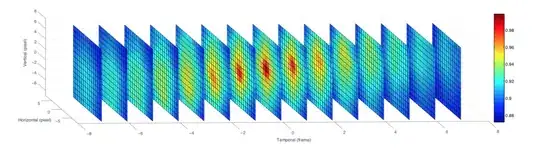
I want to plot a stack of heatmaps, contour, or grid computed over time. The plot should like this,
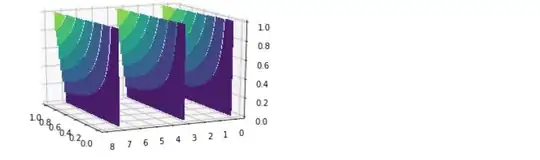
I have tried this:
from mpl_toolkits.mplot3d import Axes3D
import numpy as np
import matplotlib.pyplot as plt

fig = plt.figure()
ax = fig.gca(projection='3d')

x = np.linspace(0, 1, 100)

X, Z = np.meshgrid(x, x)
Y = np.sin(X)*np.sin(Z)


levels = np.linspace(-1, 1, 40)

ax.contourf(X, Y, Z, zdir='y')
ax.contourf(X, Y+3, Z, zdir='y')
ax.contourf(X, Y+7, Z, zdir='y')


ax.legend()

ax.view_init(15,155)
plt.show()
For one my plot looks ugly. It also does not look like what I want. I cannot make a grid there, and the 2d surfaces are tilted.
Any help is really appreciated! I am struggling with this.
Related stackoverflow:
[1] Python plot - stacked image slices
[2] Stack of 2D plot
