I just want to add annotation to each panel of figures generated by ggplot2; just simple labels like (a), (b), (c), etc. in each corner. Is there a simple way to do this?
Asked
Active
Viewed 2.2k times
3 Answers
35
From: https://groups.google.com/forum/?fromgroups=#!topic/ggplot2/RL8M7Ut5EpU you can use the following:
library(ggplot2)
x <-runif(9, 0, 125)
data <- as.data.frame(x)
data$y <- runif(9, 0, 125)
data$yy <- factor(c("a","b","c"))
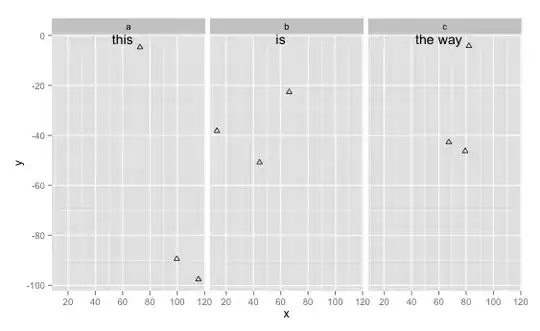
ggplot(data, aes(x, y)) +
geom_point(shape = 2) +
facet_grid(~yy) +
geom_text(aes(x, y, label=lab),
data=data.frame(x=60, y=Inf, lab=c("this","is","the way"),
yy=letters[1:3]), vjust=1)
which should give you this:
-
7+1, but could you provide a little more context to how this works? Right now it is just a piece of code and a picture. – Paul Hiemstra Apr 07 '13 at 20:30
-
4Sure. The base `ggplot` call has the data frame with the actual plot data for the `geom_point` `facet_grid` facets. The key is to setup a new data frame for the `geom_text` (created on the fly in the code snippet, but you could create it outside the `ggplot` block and just reference the data frame) and match the number of label elements to the number of facets. You can use multiple calls to `geom_text` to place multiple, different labels across the facets. They'll be referenced in order, so be mindful of that. – hrbrmstr Apr 07 '13 at 20:53
-
1If you want multiple labels to be drawn there is no need to call geom_text multiple times, just add rows to your data.frame with the appropriate text and facet_grid variables. – Paul Hiemstra Apr 07 '13 at 21:06
-
2Ah, I'd seen it but wasn't working because I had the hjust wrong. Thanks. But do you knoww the conditions under which `Inf` works? Mine just says, `Error in seq.default(from = best$lmin, to = best$lmax, by = best$lstep) : 'from' must be of length 1`. – hatmatrix Apr 07 '13 at 22:01
-
having multiple `geom_text`'s helps (IMO) if you want easier to read code for a general audience and makes it easier to tweak formatting on different labels (which I pbly errantly assumed was the case) – hrbrmstr Apr 08 '13 at 02:17
-
1@hrbrmstr -- Thanks for this great answer. I was wondering if you could provide the recipe for when x is a discrete variable? – d_a_c321 Nov 24 '13 at 19:22
8
Basically, you create a data.frame with the text which contains a column with the text, and a column with the variables you use for facet_grid. You can then simply add a geom_text with that data.frame. See the documentation of geom_text for more details on text placement and such.
Paul Hiemstra
- 59,984
- 12
- 142
- 149
1
I found this approach that maybe could be a solution for the problem: https://stackoverflow.com/a/46499601/13997761
emr2
- 1,436
- 7
- 23