4

How do I combine gridded polar and Cartesian data on a plot?

It is important to note that axes origins and scales have to match.

In my application, I want to combine weather radar data ( polar ) with elevation data (Cartesian).

This is the starting point :

enter image description here

egouden
  • 43
  • 1
  • 8

2 Answers2

13

See this other answer for more information and explanations.
Basically, you can create two overlapping axes-objects. Here is a minimal working example (which looks terrible, but illustrates the point):

import numpy as np
import matplotlib.pyplot as plt

# setting up data
line = np.random.rand(5)
r = np.arange(0, 3.0, 0.01)
theta = 2 * np.pi * r

# initializing the figure
fig = plt.figure()
# setting the axis limits in [left, bottom, width, height]
rect = [0.1, 0.1, 0.8, 0.8]

# the carthesian axis:
ax_carthesian  = fig.add_axes(rect)
# the polar axis:
ax_polar = fig.add_axes(rect, polar=True, frameon=False)

# plotting the line on the carthesian axis
ax_carthesian.plot(line,'b')

# the polar plot
ax_polar.plot(theta, r, color='r', linewidth=3)
ax_polar.set_rmax(2.0)
ax_polar.grid(True)

plt.show()

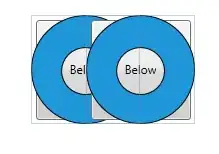
The trick is to have both axis in the same location and for the second choosing frameon=false. Your figure will look like this:

enter image description here

Community
  • 1
  • 1
Schorsch
  • 7,761
  • 6
  • 39
  • 65
  • 2
    This is a good starting point but origin and scales have to match. – egouden Sep 17 '13 at 07:45
  • 1
    @egouden Do you see now, how your question lacks vital information? I'll get to that in an edit when I have the time. – Schorsch Sep 17 '13 at 11:04
  • The current version of my question is OK. I am doing physics. It is obvious I want to compare the two datasets with corresponding location. Still I am open to discussion : please give any other application where you don't want this result. – egouden Sep 17 '13 at 11:21
  • 2
    @egouden Something which may be obvious to you, may not be so to others. Axis are an arbitrary choice. Granted, some are more useful than others, but a polar grid and a Cartesian grid can be aligned in many ways. And - not necessarily would scales have to match. That is very much dependent on your data or what you are trying to show. – Schorsch Sep 17 '13 at 11:34
  • Fine. Do you think my question is OK now? If so please remove your -1 vote and the link to a previously answered question (not the same and far less interesting IMO). Then gurus might be interested to solve the actual problem. – egouden Sep 17 '13 at 11:53
  • I propose to remove the noisy discussion about the quality of the question afterwards. However this discussion was very useful for future questions. Thank you all. – egouden Sep 17 '13 at 12:01
  • This helped me, sometimes we just need to focus on the question. I upvoted your question @egouden :) – Nicholas TJ Oct 08 '14 at 09:54
  • @Schorsch is there a way to fully span the polar grid inside the rectangular frame keeping the same origin? Thanks – AshlinJP Jul 01 '20 at 01:28
  • Instead of manually defining and/or figuring out your `rect` coordinates, the following does it automatically: `fig = plt.figure(); ax = plt.subplot(); ax_polar = fig.add_axes(ax.get_position(), polar=True, frameon=False)` – Mitchell van Zuylen Nov 16 '22 at 01:01
3

Thinking about this for a while, the answer is you need to translate you radial data into Cartesian space:

import copy
# fake....err, simulated... data

# elevation
X, Y = np.meshgrid(np.linspace(-50, 50, 1024), np.linspace(-50, 50, 1024))
elv = np.sin(np.pi * X / 50) * np.cos(2*np.pi * Y / 50)

# radar
R, theta = np.meshgrid(np.linspace(0, 35, 512), np.linspace(0, 2*np.pi, 512))
rad = np.sin(3*theta) ** 2 * np.cos(R / 10) ** 2

Rt_x = R * np.sin(theta)  # turn radial grid points into (x, y)
Rt_y = R * np.cos(theta)

fig, ax = plt.subplots(1, 1)
ax.set_aspect('equal')
# plot contour
ax.contour(X, Y, elv, cmap='gray')

# tweak color map so values below a threshold are transparent
my_cmap = copy.copy(cm.get_cmap('jet'))
my_cmap.set_under(alpha=0)
# plot the radar data
ax.pcolormesh(Rt_x, Rt_y, rad, zorder=5, edgecolor='face', cmap=my_cmap, vmin=.5, shading='flat')
output

tacaswell
  • 84,579
  • 22
  • 210
  • 199
  • This is a good answer. I still don't understand how pcolormesh knows where to colorize quickly. However do you manage to have a proper vector output? For me saving to pdf takes too much time and using pcolorfast with polar axes gives me a blank image. Then rendering is almost impossible. – egouden Sep 23 '13 at 14:15
  • @egouden Your original post did not mention vector output and my answer does not neither `pcolorfast` nor a polar exes. Please ask a new question with you new problems. Rendering thing to png is very fast. – tacaswell Sep 23 '13 at 14:24
  • Fair enough. Let's do it step by step. – egouden Sep 23 '13 at 14:28