15

Define data

x = np.linspace(0,2*np.pi,100)
y = 2*np.sin(x)

Plot

fig = plt.figure()
ax = plt.axes()
fig.add_subplot(ax)
ax.plot(x,y)

Add second axis

newax = plt.axes(axisbg='none')

Gives me ValueError: Unknown element o, even though it does the same thing as what I am about to describe. I can also see that this works (no error) to do the same thing:

newax = plt.axes()
fig.add_subplot(newax)
newax.set_axis_bgcolor('none')

However, it turns the background color of the original figure "gray" (or whatever the figure background is)? I don't understand, as I thought this would make newax transparent except for the axes and box around the figure. Even if I switch the order, same thing:

plt.close('all')
fig = plt.figure()
newax = plt.axes()
fig.add_subplot(newax)
newax.set_axis_bgcolor('none')
ax = plt.axes()
fig.add_subplot(ax)
ax.plot(x,y)

This is surprising because I thought the background of one would be overlaid on the other, but in either case it is the newax background that appears to be visible (or at least this is the color I see).

What is going on here?

hatmatrix
  • 42,883
  • 45
  • 137
  • 231

1 Answers1

51

You're not actually adding a new axes.

Matplotlib is detecting that there's already a plot in that position and returning it instead of a new axes object.

(Check it for yourself. ax and newax will be the same object.)

There's probably not a reason why you'd want to, but here's how you'd do it.

(Also, don't call newax = plt.axes() and then call fig.add_subplot(newax) You're doing the same thing twice.)

Edit: With newer (>=1.2, I think?) versions of matplotlib, you can accomplish the same thing as the example below by using the label kwarg to fig.add_subplot. E.g. newax = fig.add_subplot(111, label='some unique string')

import matplotlib.pyplot as plt

fig = plt.figure()
ax = fig.add_subplot(1,1,1)

# If you just call `plt.axes()` or equivalently `fig.add_subplot()` matplotlib  
# will just return `ax` again. It _won't_ create a new axis unless we
# call fig.add_axes() or reset fig._seen
newax = fig.add_axes(ax.get_position(), frameon=False)

ax.plot(range(10), 'r-')
newax.plot(range(50), 'g-')
newax.axis('equal')

plt.show()

enter image description here

Of course, this looks awful, but it's what you're asking for...

I'm guessing from your earlier questions that you just want to add a second x-axis? If so, this is a completely different thing.

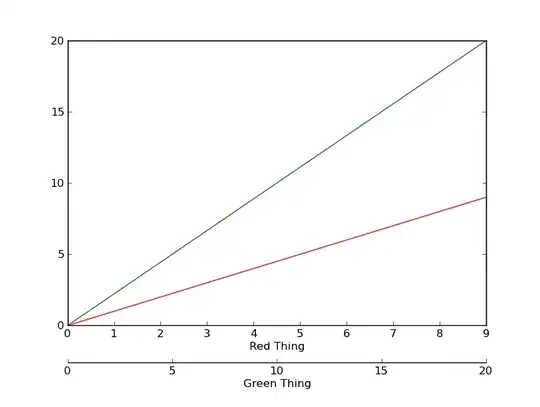
If you want the y-axes linked, then do something like this (somewhat verbose...):

import matplotlib.pyplot as plt

fig, ax = plt.subplots()
newax = ax.twiny()

# Make some room at the bottom
fig.subplots_adjust(bottom=0.20)

# I'm guessing you want them both on the bottom...
newax.set_frame_on(True)
newax.patch.set_visible(False)
newax.xaxis.set_ticks_position('bottom')
newax.xaxis.set_label_position('bottom')
newax.spines['bottom'].set_position(('outward', 40))

ax.plot(range(10), 'r-')
newax.plot(range(21), 'g-')

ax.set_xlabel('Red Thing')
newax.set_xlabel('Green Thing')

plt.show()

enter image description here

If you want to have a hidden, unlinked y-axis, and an entirely new x-axis, then you'd do something like this:

import matplotlib.pyplot as plt
import numpy as np

fig, ax = plt.subplots()
fig.subplots_adjust(bottom=0.2)

newax = fig.add_axes(ax.get_position())
newax.patch.set_visible(False)
newax.yaxis.set_visible(False)

for spinename, spine in newax.spines.iteritems():
    if spinename != 'bottom':
        spine.set_visible(False)

newax.spines['bottom'].set_position(('outward', 25))

ax.plot(range(10), 'r-')

x = np.linspace(0, 6*np.pi)
newax.plot(x, 0.001 * np.cos(x), 'g-')

plt.show()

enter image description here

Note that the y-axis values for anything plotted on newax are never shown.

If you wanted, you could even take this one step further, and have independent x and y axes (I'm not quite sure what the point of it would be, but it looks neat...):

import matplotlib.pyplot as plt
import numpy as np

fig, ax = plt.subplots()
fig.subplots_adjust(bottom=0.2, right=0.85)

newax = fig.add_axes(ax.get_position())
newax.patch.set_visible(False)

newax.yaxis.set_label_position('right')
newax.yaxis.set_ticks_position('right')

newax.spines['bottom'].set_position(('outward', 35))

ax.plot(range(10), 'r-')
ax.set_xlabel('Red X-axis', color='red')
ax.set_ylabel('Red Y-axis', color='red')

x = np.linspace(0, 6*np.pi)
newax.plot(x, 0.001 * np.cos(x), 'g-')

newax.set_xlabel('Green X-axis', color='green')
newax.set_ylabel('Green Y-axis', color='green')


plt.show()

enter image description here

You can also just add an extra spine at the bottom of the plot. Sometimes this is easier, especially if you don't want ticks or numerical things along it. Not to plug one of my own answers too much, but there's an example of that here: How do I plot multiple X or Y axes in matplotlib?

As one last thing, be sure to look at the parasite axes examples if you want to have the different x and y axes linked through a specific transformation.

Community
  • 1
  • 1
Joe Kington
  • 275,208
  • 71
  • 604
  • 463
  • Yes, indeed it was about the two axes... I wasn't getting the `twinx` and now `twiny` (guess I should have known the second existed) but I didn't think it necessary that they need to be "linked", necessarily, as long as the plot width was the same (because I can just set the limits equal then). – hatmatrix Oct 14 '11 at 19:34
  • So if I was willing to do that this first example could also work by turning off visibility of the other spines. Seems there are so many variations on each method in matplotlib that I was going for a few "general" functions that can be applied in most cases, without having to learn each of the available "convenience" functions... but thanks, this solves everything. But the plt.axes() returning the same object was a surprise -- I thought that's what plt.gca() is for. And this is different from Matlab... – hatmatrix Oct 14 '11 at 19:35
  • Well, `plt.axes()` makes a new axis in any other circumstance. It just has a piece of code that checks if there's already an axis in that position, and returns it (and makes it the current axis) if so. (Basically, that's the 3rd bullet point in the documentation for `plt.axes()`, though you have to read between the lines a bit...) – Joe Kington Oct 14 '11 at 20:24
  • I'll add a bit more detail on adding an "unlinked" x-axis. (It's basically like you said: Add the other axes on top, and then hide the other spines.) Usually, it's easier to keep things linked, though. You can even have automatic transformations set up, so that (for example) one shows in feet and the other in meters. (You use "parasite axes" for that part. It's a bit more complex.) – Joe Kington Oct 14 '11 at 20:27
  • 1
    This is really amazing... thanks so much. So basically I think I can do with `twinx`, `twiny` for linking one set of axes and `add_axes` for unlinked axes. "parasite axes" for later... (I'll keep that man page handy). – hatmatrix Oct 14 '11 at 21:34
  • Do you know if I can adjust my 'subaxis' x and y limits using these methods? It appears to shrink down my figure if I do – Jared Apr 12 '15 at 19:35
  • Its great but when I try with mpld3 its make static value for the axis its not zoom in-out for the both axis. – Jeenit khatri Mar 01 '17 at 12:13
  • Wow...what an answer! Thank you. I have a question: what if I want to use "blit update" on these two axes? Will `copy_from_bbox()`, `restore_region()` and `blit()` work? – kawing-chiu Oct 08 '17 at 04:01