2

How would I go about finding the bounding box or window for the region of whitespace surrounding the numbers in the image below?:

Original image:
enter image description here

Height: 762 pixels Width: 1014 pixels

Goal:

Something like: {x-bound:[x-upper,x-lower], y-bound:[y-upper,y-lower]} so I can crop to the text and input into tesseract or some OCR.

Attempts:

I had thought of slicing the image into hard coded chunk sizes and analysing at random, but i think it would be too slow.

Example code using pyplot adapted from (Using python and PIL how can I grab a block of text in an image?):

from PIL import Image
import numpy as np
import matplotlib.pyplot as plt
im = Image.open('/home/jmunsch/Pictures/Aet62.png')
p = np.array(im)
p = p[:,:,0:3]
p = 255 - p
lx,ly,lz = p.shape

plt.plot(p.sum(axis=1))
plt.plot(p.sum(axis=0))

#I was thinking something like this 
#The image is a 3-dimensional ndarray  [[x],[y],[color?]]
#Set each value below an axes mean to 0
[item = 0 for item in p[axis=0] if item < p.mean(axis=0)]

# and then some type of enumerated groupby for each axes
#finding the mean index for each groupby(0) on axes

plt.plot(p[mean_index1:mean_index2,mean_index3:mean_index4])

Based on the graphs each of the valleys would indicate a place to bound.

  • The first graph shows where lines of text would be
  • The second graph shows where characters would be

Plot example plt.plot(p.sum(axis=1)):

enter image description here

Plot example output plt.plot(p.sum(axis=0)):
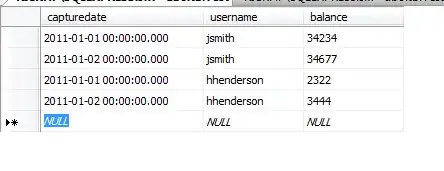
enter image description here

Related posts/docs:

update: solution by HYRY

enter image description here

Community
  • 1
  • 1
jmunsch
  • 22,771
  • 11
  • 93
  • 114
  • What do you mean by "region"? You want the coordinates for a rectangle that contains the letters in your first image? What does it need to generalize to? – machow Jul 11 '14 at 01:11
  • numpy just does arrays (and some basic stats, etc..). It sounds like you need a computer vision library like [scikit-image](http://scikit-image.org/). Especially if you don't want a bounding box for only this image (which you could probably eyeball). – machow Jul 11 '14 at 01:28
  • I appreciate the tip on a Computer Vision library, but `numpy` can manipulate arrays, which can then be converted back to images with `PIL`. As an example: `pix = np.array(im);cropped_to_corner = Image.fromarray(pix[0:200,0:200])` Just figured out how to get at the x-axis – jmunsch Jul 11 '14 at 01:40
  • What's your question, then? If you could rephrase it, or say what you've tried, it might be a little more clear what you're trying to accomplish. I don't know how the code you posted relates to your question. – machow Jul 11 '14 at 03:47
  • @machow Apologies for the confusing question. I tried to reword it after doing some reading. – jmunsch Jul 11 '14 at 07:04

1 Answers1

5

I think you can use Morphology functions in scipy.ndimage, here is an example:

import pylab as pl
import numpy as np
from scipy import ndimage
img = pl.imread("Aet62.png")[:, :, 0].astype(np.uint8)
img2 = ndimage.binary_erosion(img, iterations=40)
img3 = ndimage.binary_dilation(img2, iterations=40)
labels, n = ndimage.label(img3)
counts = np.bincount(labels.ravel())
counts[0] = 0
img4 = labels==np.argmax(counts)
img5 = ndimage.binary_fill_holes(img4)
result = ~img & img5
result = ndimage.binary_erosion(result, iterations=3)
result = ndimage.binary_dilation(result, iterations=3)
pl.imshow(result, cmap="gray")

the output is:

enter image description here

HYRY
  • 94,853
  • 25
  • 187
  • 187
  • very cool. I'll probably use `-result` for tesseract. Is it overall just a bad idea trying to use histograms? (e.g. http://scipy-lectures.github.io/packages/scikit-image/#histogram-based-method-otsu-thresholding ) For the less mathematically inclined like myself? – jmunsch Jul 11 '14 at 16:01