202

After my previous question on finding toes within each paw, I started loading up other measurements to see how it would hold up. Unfortunately, I quickly ran into a problem with one of the preceding steps: recognizing the paws.

You see, my proof of concept basically took the maximal pressure of each sensor over time and would start looking for the sum of each row, until it finds on that != 0.0. Then it does the same for the columns and as soon as it finds more than 2 rows with that are zero again. It stores the minimal and maximal row and column values to some index.

alt text

As you can see in the figure, this works quite well in most cases. However, there are a lot of downsides to this approach (other than being very primitive):

  • Humans can have 'hollow feet' which means there are several empty rows within the footprint itself. Since I feared this could happen with (large) dogs too, I waited for at least 2 or 3 empty rows before cutting off the paw.

    This creates a problem if another contact made in a different column before it reaches several empty rows, thus expanding the area. I figure I could compare the columns and see if they exceed a certain value, they must be separate paws.

  • The problem gets worse when the dog is very small or walks at a higher pace. What happens is that the front paw's toes are still making contact, while the hind paw's toes just start to make contact within the same area as the front paw!

    With my simple script, it won't be able to split these two, because it would have to determine which frames of that area belong to which paw, while currently I would only have to look at the maximal values over all frames.

Examples of where it starts going wrong:

alt text alt text

So now I'm looking for a better way of recognizing and separating the paws (after which I'll get to the problem of deciding which paw it is!).

Update:

I've been tinkering to get Joe's (awesome!) answer implemented, but I'm having difficulties extracting the actual paw data from my files.

alt text

The coded_paws shows me all the different paws, when applied to the maximal pressure image (see above). However, the solution goes over each frame (to separate overlapping paws) and sets the four Rectangle attributes, such as coordinates or height/width.

I can't figure out how to take these attributes and store them in some variable that I can apply to the measurement data. Since I need to know for each paw, what its location is during which frames and couple this to which paw it is (front/hind, left/right).

So how can I use the Rectangles attributes to extract these values for each paw?

I have the measurements I used in the question setup in my public Dropbox folder (example 1, example 2, example 3). For anyone interested I also set up a blog to keep you up to date :-)

Community
  • 1
  • 1
Ivo Flipse
  • 10,222
  • 18
  • 50
  • 63

3 Answers3

366

If you're just wanting (semi) contiguous regions, there's already an easy implementation in Python: SciPy's ndimage.morphology module. This is a fairly common image morphology operation.


Basically, you have 5 steps:

def find_paws(data, smooth_radius=5, threshold=0.0001):
    data = sp.ndimage.uniform_filter(data, smooth_radius)
    thresh = data > threshold
    filled = sp.ndimage.morphology.binary_fill_holes(thresh)
    coded_paws, num_paws = sp.ndimage.label(filled)
    data_slices = sp.ndimage.find_objects(coded_paws)
    return object_slices
  1. Blur the input data a bit to make sure the paws have a continuous footprint. (It would be more efficient to just use a larger kernel (the structure kwarg to the various scipy.ndimage.morphology functions) but this isn't quite working properly for some reason...)

  2. Threshold the array so that you have a boolean array of places where the pressure is over some threshold value (i.e. thresh = data > value)

  3. Fill any internal holes, so that you have cleaner regions (filled = sp.ndimage.morphology.binary_fill_holes(thresh))

  4. Find the separate contiguous regions (coded_paws, num_paws = sp.ndimage.label(filled)). This returns an array with the regions coded by number (each region is a contiguous area of a unique integer (1 up to the number of paws) with zeros everywhere else)).

  5. Isolate the contiguous regions using data_slices = sp.ndimage.find_objects(coded_paws). This returns a list of tuples of slice objects, so you could get the region of the data for each paw with [data[x] for x in data_slices]. Instead, we'll draw a rectangle based on these slices, which takes slightly more work.


The two animations below show your "Overlapping Paws" and "Grouped Paws" example data. This method seems to be working perfectly. (And for whatever it's worth, this runs much more smoothly than the GIF images below on my machine, so the paw detection algorithm is fairly fast...)
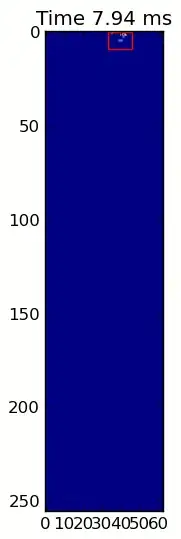
Overlapping Paws Grouped Paws


Here's a full example (now with much more detailed explanations). The vast majority of this is reading the input and making an animation. The actual paw detection is only 5 lines of code.

import numpy as np
import scipy as sp
import scipy.ndimage

import matplotlib.pyplot as plt
from matplotlib.patches import Rectangle

def animate(input_filename):
    """Detects paws and animates the position and raw data of each frame
    in the input file"""
    # With matplotlib, it's much, much faster to just update the properties
    # of a display object than it is to create a new one, so we'll just update
    # the data and position of the same objects throughout this animation...

    infile = paw_file(input_filename)

    # Since we're making an animation with matplotlib, we need 
    # ion() instead of show()...
    plt.ion()
    fig = plt.figure()
    ax = fig.add_subplot(111)
    fig.suptitle(input_filename)

    # Make an image based on the first frame that we'll update later
    # (The first frame is never actually displayed)
    im = ax.imshow(infile.next()[1])

    # Make 4 rectangles that we can later move to the position of each paw
    rects = [Rectangle((0,0), 1,1, fc='none', ec='red') for i in range(4)]
    [ax.add_patch(rect) for rect in rects]

    title = ax.set_title('Time 0.0 ms')

    # Process and display each frame
    for time, frame in infile:
        paw_slices = find_paws(frame)

        # Hide any rectangles that might be visible
        [rect.set_visible(False) for rect in rects]

        # Set the position and size of a rectangle for each paw and display it
        for slice, rect in zip(paw_slices, rects):
            dy, dx = slice
            rect.set_xy((dx.start, dy.start))
            rect.set_width(dx.stop - dx.start + 1)
            rect.set_height(dy.stop - dy.start + 1)
            rect.set_visible(True)

        # Update the image data and title of the plot
        title.set_text('Time %0.2f ms' % time)
        im.set_data(frame)
        im.set_clim([frame.min(), frame.max()])
        fig.canvas.draw()

def find_paws(data, smooth_radius=5, threshold=0.0001):
    """Detects and isolates contiguous regions in the input array"""
    # Blur the input data a bit so the paws have a continous footprint 
    data = sp.ndimage.uniform_filter(data, smooth_radius)
    # Threshold the blurred data (this needs to be a bit > 0 due to the blur)
    thresh = data > threshold
    # Fill any interior holes in the paws to get cleaner regions...
    filled = sp.ndimage.morphology.binary_fill_holes(thresh)
    # Label each contiguous paw
    coded_paws, num_paws = sp.ndimage.label(filled)
    # Isolate the extent of each paw
    data_slices = sp.ndimage.find_objects(coded_paws)
    return data_slices

def paw_file(filename):
    """Returns a iterator that yields the time and data in each frame
    The infile is an ascii file of timesteps formatted similar to this:

    Frame 0 (0.00 ms)
    0.0 0.0 0.0
    0.0 0.0 0.0

    Frame 1 (0.53 ms)
    0.0 0.0 0.0
    0.0 0.0 0.0
    ...
    """
    with open(filename) as infile:
        while True:
            try:
                time, data = read_frame(infile)
                yield time, data
            except StopIteration:
                break

def read_frame(infile):
    """Reads a frame from the infile."""
    frame_header = infile.next().strip().split()
    time = float(frame_header[-2][1:])
    data = []
    while True:
        line = infile.next().strip().split()
        if line == []:
            break
        data.append(line)
    return time, np.array(data, dtype=np.float)

if __name__ == '__main__':
    animate('Overlapping paws.bin')
    animate('Grouped up paws.bin')
    animate('Normal measurement.bin')

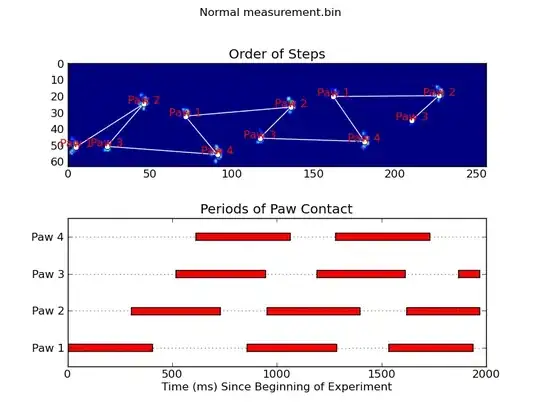
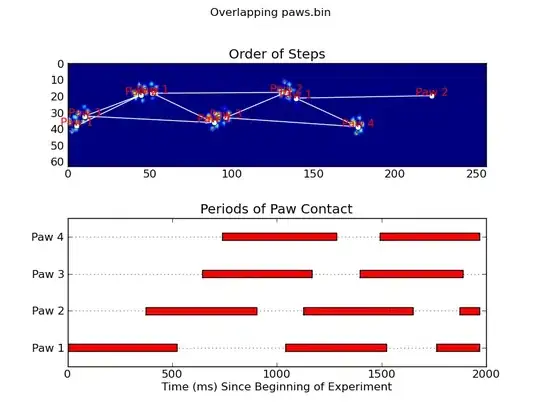
Update: As far as identifying which paw is in contact with the sensor at what times, the simplest solution is to just do the same analysis, but use all of the data at once. (i.e. stack the input into a 3D array, and work with it, instead of the individual time frames.) Because SciPy's ndimage functions are meant to work with n-dimensional arrays, we don't have to modify the original paw-finding function at all.

# This uses functions (and imports) in the previous code example!!
def paw_regions(infile):
    # Read in and stack all data together into a 3D array
    data, time = [], []
    for t, frame in paw_file(infile):
        time.append(t)
        data.append(frame)
    data = np.dstack(data)
    time = np.asarray(time)

    # Find and label the paw impacts
    data_slices, coded_paws = find_paws(data, smooth_radius=4)

    # Sort by time of initial paw impact... This way we can determine which
    # paws are which relative to the first paw with a simple modulo 4.
    # (Assuming a 4-legged dog, where all 4 paws contacted the sensor)
    data_slices.sort(key=lambda dat_slice: dat_slice[2].start)

    # Plot up a simple analysis
    fig = plt.figure()
    ax1 = fig.add_subplot(2,1,1)
    annotate_paw_prints(time, data, data_slices, ax=ax1)
    ax2 = fig.add_subplot(2,1,2)
    plot_paw_impacts(time, data_slices, ax=ax2)
    fig.suptitle(infile)

def plot_paw_impacts(time, data_slices, ax=None):
    if ax is None:
        ax = plt.gca()

    # Group impacts by paw...
    for i, dat_slice in enumerate(data_slices):
        dx, dy, dt = dat_slice
        paw = i%4 + 1
        # Draw a bar over the time interval where each paw is in contact
        ax.barh(bottom=paw, width=time[dt].ptp(), height=0.2, 
                left=time[dt].min(), align='center', color='red')
    ax.set_yticks(range(1, 5))
    ax.set_yticklabels(['Paw 1', 'Paw 2', 'Paw 3', 'Paw 4'])
    ax.set_xlabel('Time (ms) Since Beginning of Experiment')
    ax.yaxis.grid(True)
    ax.set_title('Periods of Paw Contact')

def annotate_paw_prints(time, data, data_slices, ax=None):
    if ax is None:
        ax = plt.gca()

    # Display all paw impacts (sum over time)
    ax.imshow(data.sum(axis=2).T)

    # Annotate each impact with which paw it is
    # (Relative to the first paw to hit the sensor)
    x, y = [], []
    for i, region in enumerate(data_slices):
        dx, dy, dz = region
        # Get x,y center of slice...
        x0 = 0.5 * (dx.start + dx.stop)
        y0 = 0.5 * (dy.start + dy.stop)
        x.append(x0); y.append(y0)

        # Annotate the paw impacts         
        ax.annotate('Paw %i' % (i%4 +1), (x0, y0),  
            color='red', ha='center', va='bottom')

    # Plot line connecting paw impacts
    ax.plot(x,y, '-wo')
    ax.axis('image')
    ax.set_title('Order of Steps')
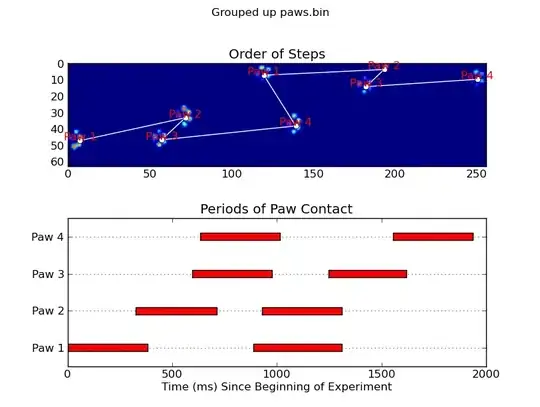
alt text


alt text


alt text

Peter Mortensen
  • 30,738
  • 21
  • 105
  • 131
Joe Kington
  • 275,208
  • 71
  • 604
  • 463
  • @Joe: Great answer! How did you make the gifs? I can `plt.savefig(...)` to create a collection of pngs, but imagemagick's `convert *.png output.gif` brings my machine to its knees... – unutbu Nov 04 '10 at 20:15
  • Make another SO question out of that @unutbu ;-) Then I can upvote his awesomeness again! – Ivo Flipse Nov 04 '10 at 20:19
  • 1
    @Ivo: Yes, I would enjoy upvoting Joe some more too :) but should I start a new question, or perhaps @Joe, if you would, answer here? http://stackoverflow.com/questions/2546780/python-animation-with-matplotlib-pyplot – unutbu Nov 04 '10 at 20:26
  • 2
    I actually just dumped out .png's, and did a `convert *.png output.gif`. I've certainly had imagemagick bring my machine to its knees before, though it worked fine for this example. In the past, I've used this script: http://svn.effbot.python-hosting.com/pil/Scripts/gifmaker.py to directly write an animated gif from python without saving the individual frames. Hope that helps! I'll post an example at the question @unutbu mentioned. – Joe Kington Nov 04 '10 at 20:59
  • 1
    Thanks for the information, @Joe. Part of my problem was neglecting to use `bbox_inches='tight'` in the `plt.savefig`, the other was impatience :) – unutbu Nov 04 '10 at 23:34
  • @unutbu - By the way, I was remembering using `gifmaker` to save animated gif's of grayscale images... I just realized that it has some serious glitches when making an animated gif with indexed colors... I'm holding off on posting an example until I get the color palette problem figured out. Regardless, I hope it helps some! And on a side note, yeah, the `bbox_inches='tight'` part helps a _lot_ in this case! – Joe Kington Nov 05 '10 at 03:00
  • @Joe I updated my question, as I'm having some trouble converting the Rectangle attributes to regular index values for each paws. Care to have another look? – Ivo Flipse Nov 09 '10 at 17:27
  • @Ivo - Sorry for the delay! I've been traveling for the past couple of days... The good news is that I think it should be very simple to do what you want! (Using the 3D array of all the frames instead of operating on a series of 2D arrays should fix the problem. All of the scipy.ndimage functions will work just fine in N-dimensions.) Unfortunately, I have to wrap up some things, but I'll try to update my answer later this afternoon. – Joe Kington Nov 11 '10 at 17:27
  • Never thought about doing that, I guess it would return a 3D slice too then. Well, no hurry in the update! I'm already very happy with your help :-) – Ivo Flipse Nov 11 '10 at 17:37
  • @Ivo - Glad to help! I'm a little worried about the implicit assumption that a dog's 4 feet will always land in sequential order... (i.e It assumes that there will be 3 impacts of other paws before the same paw lands again.) Looking at the plots above, I'm not too certain that that's a good assumption... You probably have a better idea of whether or not that's reasonable than I do. I can't think of another way to do it, though (beyond trying to recognize each paw individually, as per your original question). – Joe Kington Nov 12 '10 at 20:25
  • Ah! It just occurred to me why that doesn't work! Even if the dog's feet land in sequential order, the dog's rear paws are off the sensor when the front two first touch the sensor... Therefore, even if there are 3 "footfalls" between the same paw hitting the ground again, some of these occur off the sensor for the first few "footfalls"... Makes perfect sense, in retrospect, of course... At any rate, the plots above are wrong... – Joe Kington Nov 12 '10 at 20:59
  • The first contact (in time, not location) is always a front paw @Joe and I have logs to check which it is for each trial. So as long as the ordering stays consistent, it should do pretty well. But I'll have to try it out on all data, to see when it doesn't work. Hopefully it will be fairly straight forward to separate left and right, will have to try it out! – Ivo Flipse Nov 12 '10 at 21:15
  • It got a lot of attention because the question was answered so incredibly well. Also, if you're looking for gif animation creation within python you may have a look at this: http://www.robert-king.com/#post2-python-makes-gif – astromax Aug 28 '13 at 02:35
5

I'm no expert in image detection, and I don't know Python, but I'll give it a whack...

To detect individual paws, you should first only select everything with a pressure greater than some small threshold, very close to no pressure at all. Every pixel/point that is above this should be "marked." Then, every pixel adjacent to all "marked" pixels becomes marked, and this process is repeated a few times. Masses that are totally connected would be formed, so you have distinct objects. Then, each "object" has a minimum and maximum x and y value, so bounding boxes can be packed neatly around them.

Pseudocode:

(MARK) ALL PIXELS ABOVE (0.5)

(MARK) ALL PIXELS (ADJACENT) TO (MARK) PIXELS

REPEAT (STEP 2) (5) TIMES

SEPARATE EACH TOTALLY CONNECTED MASS INTO A SINGLE OBJECT

MARK THE EDGES OF EACH OBJECT, AND CUT APART TO FORM SLICES.

That should about do it.

TaslemGuy
  • 594
  • 5
  • 13
1

Note: I say pixel, but this could be regions using an average of the pixels. Optimization is another issue...

Sounds like you need to analyze a function (pressure over time) for each pixel and determine where the function turns (when it changes > X in the other direction it is considered a turn to counter errors).

If you know at what frames it turns, you will know the frame where the pressure was the most hard and you will know where it was the least hard between the two paws. In theory, you then would know the two frames where the paws pressed the most hard and can calculate an average of those intervals.

after which I'll get to the problem of deciding which paw it is!

This is the same tour as before, knowing when each paw applies the most pressure helps you decide.

Tamara Wijsman
  • 12,198
  • 8
  • 53
  • 82