0

I am doing a big conversion of database objects from T-SQL to PL/SQL (i.e. Microsoft to Oracle). I've two sheets tracking them. One is for existing procedures that are being converted and the other is for new ones that I've had to create. They both have the following columns:

Object Name   
Object Type   
-- other details inc lines of code etc   
Conversion Status   
Phase of move

What I want to do is create a chart where I can effectively group both sets of data together, with a slicer to choose which phase to view. There are five phases, so ideally I could choose phase one and see that out of 28 items in both sheets, 25 are done, 2 are still being test and 1 isn't started. If it could show new v. existing that would be good, but not essential.

However, I'm not really clear on how to do this. I tried to create a data model and combine both sets of data, but it wanted a relationship between them. I tried to provide Phase of move, but as it's not unique Excel wouldn't have it.

What's my next step?


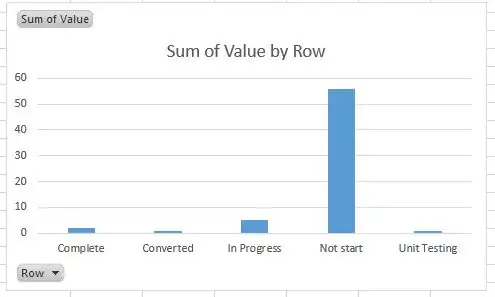
To explain what I'm after, here's a chart from the first data set:

enter image description here

Here's a chart from the second data set:

enter image description here

What I basically want is a pivot chart (or regular chart) which combines both of these sets of information.

The Phase option and the Transition State options are common across both sheets. If there are ten items completed, in phase 1, on sheet 1, and five items completed, in phase 1, on sheet 2, I want my pivot chart to display fifteen items completed for phase 1.


It seems @pnuts solution is what I want, but I'm still having trouble. This is my (new and combined) PivotTable:

I did these steps:

  • CTRL, D, P on first sheet
  • Multiple consolidation ranges / pivot table
  • I will create the page fields
  • I chose range J:M on the first sheet and then "add"
  • I selected the other sheet and chose range C:F and then add (note, these are the same four columns, in same order, from both sheets).
  • Page fields was left at 0.
  • I chose Next.
  • I chose to export to an existing worksheet.

It does all of its calculations and gives me this:

enter image description here

Obviously, this is incorrect. If I change count to sum, I get 0 for everything. Here is some sample data, based on my first sheet:

enter image description here

What on earth am I doing wrong?

Edit 3:

Additional info at @pnuts request:

enter image description here

pnuts
  • 58,317
  • 11
  • 87
  • 139
Andrew Martin
  • 5,619
  • 10
  • 54
  • 92
  • @pnuts: Apologies but I'm not sure what you mean. – Andrew Martin Feb 13 '15 at 15:47
  • The number is actually slightly higher (as I changed a few things in the meantime). I've added a sample of what I get. I filtered on 1 - Billing Activation in the first column. That's the sort of data I get. – Andrew Martin Feb 13 '15 at 16:00

1 Answers1

1

Create a pivot table from multiple consolidation ranges (eg see here) then pivot the resulting Table.

Edit based on data sample now provided

This is what I get:

SO28499867 example

though I charted the Table without bothering to pivot that.

Community
  • 1
  • 1
pnuts
  • 58,317
  • 11
  • 87
  • 139
  • I tried this, but it ran out of memory trying to compile it. There's around 1,300 items in one table and about ten in the other. The 1,300 items will be constantly updated, but will never increase - the ten will most certainly increase. – Andrew Martin Feb 13 '15 at 13:07
  • I just keep getting "Excel cannot complete this task with available resources. Choose less data or close other applications". As soon as I click OK I'm told "There isn't enough memory to complete this action". I've tried selecting just five columns from each sheet and I'm still having issues. Nothing is going crazy in the Task Manager - I'm not hitting 95% usage or anything like that. It just won't do the job for some reason – Andrew Martin Feb 13 '15 at 13:17
  • I'm adding both ranges, so I have two separate ranges with the five columns. Page fields is still 0 like in the example. I choose export to New Worksheet. The reading data bar completes quite quickly then starts again. It again goes quite quickly but on the second time of completion I get the error message – Andrew Martin Feb 13 '15 at 13:19
  • Note I have 8GB of RAM, 32 bit excel – Andrew Martin Feb 13 '15 at 13:19
  • That seemed to do the trick, but I'm not sure if this solution is what I'm after. I was hoping to group by the phase, then display a count of all items at each conversion stage. Doing this groups by phase okay, but just displays a flat count of all items with a state, i.e. Phase 1 has 10 items - 6 in progress, 3 testing, 1 not begun. But the chart just shows - Phase 1 : 10 – Andrew Martin Feb 13 '15 at 14:26
  • I appreciate that. I've edited my question - I hope it provides a little more context to what I'm after. – Andrew Martin Feb 13 '15 at 14:53
  • What order did you select things in? My columns are in this order: Transition Phase, Release Phase, Transition Status, Transition State. I'm not using Release Phase or Transition Status. My items are all grouped by Transition Phase and when I choose "Sum of Value" everything displays 0 (even though there's data in it). – Andrew Martin Feb 13 '15 at 15:20
  • I just cannot seem to get that. I've edited my question further with more screenshots. I just can't seem to get things working – Andrew Martin Feb 13 '15 at 15:37