13

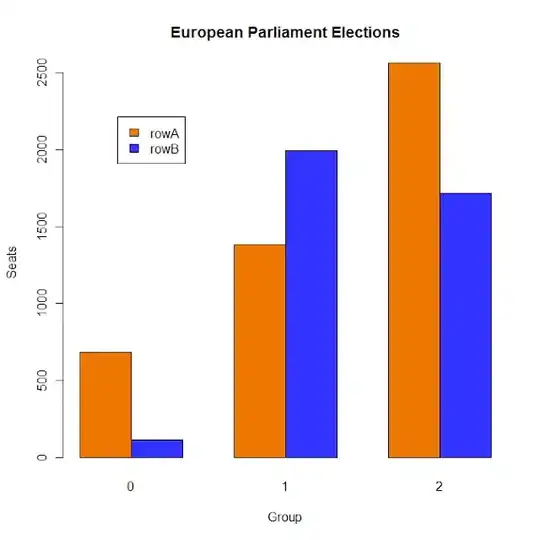
I have the following data:

bin groupname   total_dist
0   rowA    377
0   rowA    306.6
0   rowB    2.1
0   rowB    110.6
1   rowA    918.1
1   rowA    463.2
1   rowB    798.2
1   rowB    1196
2   rowA    1295.1
2   rowA    1269.1
2   rowB    698
2   rowB    1022.1

Using R, I want to make a bar graph where there is a bar for rowA and a bar for rowB for each bin. I can group total_dist by one or the other (plot(total_dist~bin) or plot(total_dist~groupname)). But I can't figure out how to combine them.

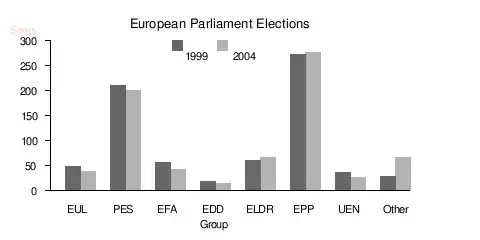
I want something that looks similar to this example: example grouped bar graph

Community
  • 1
  • 1
dnagirl
  • 20,196
  • 13
  • 80
  • 123
  • could you specify better? in the lower graph example, EUL, PES, EFA ... are the bins? the example has 2 bars per group ... "two bars" corresponds to rowA/rowB, groups to? we have two values per rowX, so we have 4 values for bin, so we should have 4 bars per "group"? (instead of 2 of the example..)?? please could you sketch how you want it really? – ShinTakezou Jun 09 '10 at 15:29
  • have you to "group" the doubles (rowA rowA, rowB rowB) into a single value so that you've have 2 bars per bin instead of 4? and how do you "combine" total_dist in the same bin and with same groupname (sum? mean?) – ShinTakezou Jun 09 '10 at 15:50
  • @ShinTakezou: If my data were mapped to the example graph, bin=>group and groupname=>year. So bin would be the x-axis labels and groupname would correspond to the column colouring. – dnagirl Jun 09 '10 at 16:16
  • you have 4 values per bin, how do you want to group them? or should them remain separatd? – ShinTakezou Jun 09 '10 at 16:19

1 Answers1

29

Here is a classic solution. (Supposing your dataframe is named df )

data <- tapply(df$total_dist, list(df$groupname,df$bin), sum)

barplot(data,beside=T,col=c("#ee7700","#3333ff")
,main="European Parliament Elections",xlab="Group",ylab="Seats")

legend(locator(1),rownames(data),fill=c("#ee7700","#3333ff"))

and here is solution using ggplot2

library(ggplot2)
qplot(factor(bin),data=df,geom="bar",fill=groupname,weight=total_dist,position="dodge",
main = "European Parliament Elections", xlab="Group",ylab="Seats")

alt text

Community
  • 1
  • 1
gd047
  • 29,749
  • 18
  • 107
  • 146