4

I am trying to create grouped bar plot with R. I tried the following code to create a simple barplot.

x=c(99,9,104,67,86,53,83,29,127,31,179,86,74,80,100,150,68,18,81,47)
names(x)= c("A","C","E","D","G","F","I","H","K","M","L","N","Q","P","S","R","T","W","V","Y") 
    barplot(x)
y= c(105673,18140,92426,76776,93974,53470,75155,30700,77847,28863,124602,55703,
50160,60685,78693,69581,70846,18285,92789,45728)
names(y)= c("A","C","E","D","G","F","I","H","K","M","L","N","Q","P","S","R","T","W","V","Y") 
barplot(y)

I have to combine the above two bar plots. I can't figure out how to combine them.

I tried with gplot.

require(ggplot2)
data(mydata)
head(mydata)
ggplot(mydata, aes(aminoacid, fill=cut)) + geom_bar(position="dodge") +
opts(title="aminoacid analysis ")

Error in data.frame(x = c(2L, 3L, 5L, 4L, 7L, 6L, 9L, 8L, 10L, 12L, 11L,  :  

arguments imply differing number of rows: 21, 228

I tried the following code also.

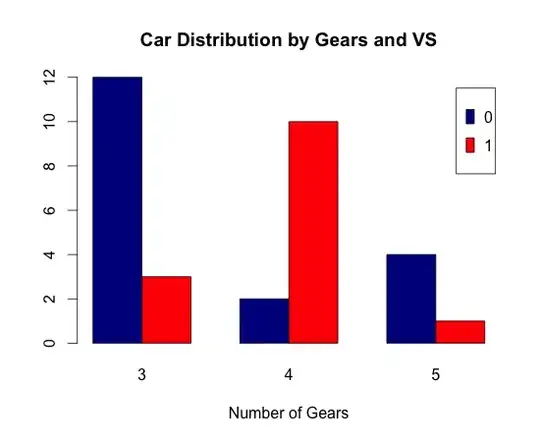
counts <- table(mydata)
barplot(counts, main="amino acid analysis",`xlab="aminoacid codes", col=c("darkblue","red")`legend = rownames(counts), beside=TRUE))

Error in barplot.default(counts, main = "aminoacid analysis",  :
'height' must be a vector or a matrix   

How can I solve these errors?

Please help me to create a grouped barplot with R.

saraswathi
  • 93
  • 1
  • 3
  • 7
  • How about searching Stack Overflow for '[r] grouped bar plot' or '[r] grouped barplot'? I immediately find this, which should answer your question: http://stackoverflow.com/questions/3007120/grouped-bar-graph – Josh O'Brien Nov 16 '11 at 09:06
  • wait, does this make sense at all? barplot display counts here and y,x do not look like categories we could count... – Matt Bannert Nov 16 '11 at 11:42
  • You didn't show the contents of `mydata`. – Davor Cubranic May 06 '15 at 17:32

1 Answers1

15

Welcome to SO.

You might want to look at ggplot2 , on Hadley's page you will find detailed examples how to do it. Here's an example:

# if you haven't installed ggplot, if yes leave this line out
install.packages("ggplot2") # choose your favorite mirror

require(ggplot2)
data(diamonds)
# check the dataset
head(diamonds)
# plot it 
ggplot(diamonds, aes(clarity, fill=cut)) + geom_bar(position="dodge") +
opts(title="Examplary Grouped Barplot")

enter image description here

What's nice about the ggplot2 package is that you can change the visualization of some parameter (aesthetic,aes) easily. For example you could look into facects or stacked barcharts instead of grouping them. Plus, it's well documented on Hadley's page.

For the sake of completeness, here's also a non ggplot2 example found @quickR

# Grouped Bar Plot
counts <- table(mtcars$vs, mtcars$gear)
barplot(counts, main="Car Distribution by Gears and VS",
xlab="Number of Gears", col=c("darkblue","red"),
 legend = rownames(counts), beside=TRUE)

enter image description here

Matt Bannert
  • 27,631
  • 38
  • 141
  • 207
  • Thank you so much for your code. I tried your code using ggplot2. But I am getting this error . Error in data.frame(x = c(2L, 3L, 5L, 4L, 7L, 6L, 9L, 8L, 10L, 12L, 11L, : arguments imply differing number of rows: 21, 228. – saraswathi Nov 16 '11 at 10:22
  • hmm, are you using your own dataset, or the diamonds sample like i did? If I c&p my code straight from here and run it in fresh R session it works fine. If you could provide a reproducible example with same sample data of the same structure, I could look into that. Try using dput(head((yourdata)) and paste it here. Besides you could try traceback() after running the code and try to find out own your own whats wrong. – Matt Bannert Nov 16 '11 at 11:26
  • lol I realize I had a typo in the example title, was working on boxplots the whole day :) – Matt Bannert Nov 16 '11 at 11:37
  • I used my own data set. I checked diamonds sample. it worked fine. Please look at my edited question. – saraswathi Nov 16 '11 at 12:08
  • I like your ggplot2 answer however I don't know how to apply it to my dataframe here http://stackoverflow.com/questions/40518248/showing-barplots-that-contains-groups-of-three-barplots-adjacent-to-each-other-f plus the link doesn't work anymore :( please have a look – Mona Jalal Nov 10 '16 at 01:03
  • What if you want to have the "3" bars in red, the "4" bars in blue, and the "5" bars in green? In short, how can you avoid the intermittent colors? – FaCoffee Apr 21 '17 at 07:06