Here is a simpler approach, that works for many colormaps, e.g. viridis, though not for LinearSegmentedColormaps such as 'jet'.
The colormaps are stored as lists of [r,g,b] values. For lots of colormaps, this map has exactly 256 entries. A value between 0 and 1 is looked up using its nearest neighbor in the color list. So, you can't get the exact value back, only an approximation.
Some code to illustrate the concepts:
from matplotlib import pyplot as plt

def find_value_in_colormap(tup, cmap):
    # for a cmap like viridis, the result of the colormap lookup is a tuple (r, g, b, a), with a always being 1
    # but the colors array is stored as a list [r, g, b]
    # for some colormaps, the situation is reversed: the lookup returns a list, while the colors array contains tuples
    tup = list(tup)[:3]
    colors = cmap.colors
    if tup in colors:
        ind = colors.index(tup)
    elif tuple(tup) in colors:
        ind = colors.index(tuple(tup))
    else: # tup was not generated by this colormap
        return None
    return (ind + 0.5) / len(colors)

val = 0.3
tup = plt.cm.viridis(val)

print(find_value_in_colormap(tup, plt.cm.viridis))
This prints the approximate value:
0.298828125
being the value corresponding to the color triple.
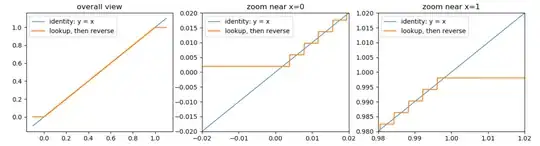
To illustrate what happens, here is a visualization of the function looking up a color for a value, followed by getting the value corresponding to that color.
from matplotlib import pyplot as plt
import numpy as np

x = np.linspace(-0.1, 1.1, 10000)
y = [ find_value_in_colormap(plt.cm.viridis(x), plt.cm.viridis) for x in x]

fig, axes = plt.subplots(ncols=3, figsize=(12,4))
for ax in axes.ravel():
    ax.plot(x, x, label='identity: y = x')
    ax.plot(x, y, label='lookup, then reverse')
    ax.legend(loc='best')
axes[0].set_title('overall view')
axes[1].set_title('zoom near x=0')
axes[1].set_xlim(-0.02, 0.02)
axes[1].set_ylim(-0.02, 0.02)
axes[2].set_title('zoom near x=1')
axes[2].set_xlim(0.98, 1.02)
axes[2].set_ylim(0.98, 1.02)
plt.show()
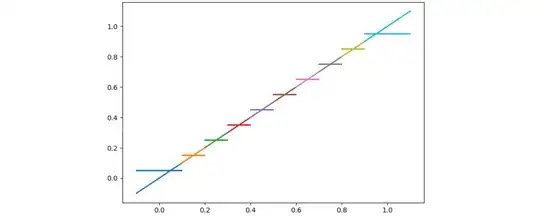
For a colormap with only a few colors, a plot can show the exact position where one color changes to the next. The plot is colored corresponding to the x-values.

