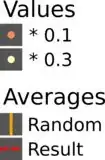
Is there any way that I can create a completely custom legend that won't care about the aesthetics or anything else in my plot? I would like if possible to design everything from scratch. How many groups of legends I will have, what will be the title, shape, color, size, linetype, fill, label, order etc for each legend. I have already spent almost two working days try to figure out how to create the legends to look the way I want them to look (The plot itself didn't take more than a few minutes after I had the data).
Take a look at the following sample code (random data, but fine for demonstrating what I want):
require(dplyr)
require(RColorBrewer)

col <- brewer.pal(3, "Spectral")

a <- data.frame(multiplier = c(0.5, 0.7, 1.0), multiplier2 = c(0.3, 0.1), random = runif(3 * 500))
a$result = a$multiplier * a$random * runif(length(a$random)) * a$multiplier2

a_grouped_by_multiplier = group_by(a, multiplier)
means = summarise(a_grouped_by_multiplier, mean_rand = mean(random), mean_res = mean(result))

ggplot(a, aes(x = random, y = result)) +
  geom_density2d(bins = 20) +
  geom_point(aes(color = factor(multiplier2)), size = 0.7) +
  geom_vline(data = means, aes(xintercept = mean_rand), color = "orange", linetype = "solid", size = 1.5, show.legend = TRUE) +
  geom_hline(data = means, aes(yintercept = mean_res), color = "red", linetype = "dashed", size = 1.5, show.legend = TRUE) +
  scale_color_manual(name = "Values", values = c(col[1], col[2]), labels = c("* 0.1", "* 0.3")) +
  facet_grid(~ multiplier) +
  theme(panel.grid.major = element_line(colour = "white", linetype = "dashed", size = 0.3),
        panel.grid.minor = element_blank(),
        panel.background = element_rect(fill = "#555555"),
        legend.key = element_rect(fill = "#555555"))
That creates the following plot:
I have tried to customize endless parameters to get the desired result. Used all the different scale_*_manual functions with different parameters, used the show.legends = FALSE, tried the guide() function with different guide_legend() parameters, I tried to make the color, linetype, size etc parameters part of the aesthetics (one by one and all combined), but nothing so far worked for creating a legend like the following (created by inkscape here):
My first problem is that I cannot get two legend groups: one for the "Values" and one for the "Averages". Second problem is that due to the geom_hline and geom_vline, vertical and horizontal lines appear in all of the legend boxes. Note that I also use a different data frame for the geom_hline and geom_vline.


