253

In Python, with Matplotlib, how can a scatter plot with empty circles be plotted? The goal is to draw empty circles around some of the colored disks already plotted by scatter(), so as to highlight them, ideally without having to redraw the colored circles.

I tried facecolors=None, to no avail.

Eric O. Lebigot
  • 91,433
  • 48
  • 218
  • 260
  • 1
    People looking to draw empty/hollow scatter plots with different colors may look at [this question](https://stackoverflow.com/questions/45250916/matplotlib-scatter-edge-without-specifying-edgecolor). – ImportanceOfBeingErnest Mar 25 '18 at 18:03

6 Answers6

364

From the documentation for scatter:

Optional kwargs control the Collection properties; in particular:

    edgecolors:
        The string ‘none’ to plot faces with no outlines
    facecolors:
        The string ‘none’ to plot unfilled outlines

Try the following:

import matplotlib.pyplot as plt 
import numpy as np 

x = np.random.randn(60) 
y = np.random.randn(60)

plt.scatter(x, y, s=80, facecolors='none', edgecolors='r')
plt.show()

example image

Note: For other types of plots see this post on the use of markeredgecolor and markerfacecolor.

Community
  • 1
  • 1
Gary Kerr
  • 13,650
  • 4
  • 48
  • 51
  • 8
    Thanks! The gotcha is that the more usual (in Python) `facecolors=None` does not work, which tripped me. – Eric O. Lebigot Mar 01 '15 at 06:49
  • 38
    Very helpful. It's `markerfacecolor='none'`, this is the way it's now. – hesham_EE May 28 '15 at 03:16
  • 4
    I had my matplotlib style in a way that set the edges widths to zero. If you don't see any markers with `markerfacecolor='none'` try adding `markeredgewidth=1.0` – oLas Sep 19 '17 at 19:44
  • This approach can also be used in Seaborn after doing the standard import of Matplotlib `%matplotlib inline` and `import matplotlib.pyplot as plt`, and then setting Seaborn to be the plotting default by `import seaborn as sns; sns.set()` – Jakob Jul 30 '19 at 08:37
  • 1
    The edge widths are currently (v3.4.2) specified by the parameter `linewidths` instead of `markeredgewidth`. [Documentation](https://matplotlib.org/stable/api/_as_gen/matplotlib.pyplot.scatter.html#matplotlib.pyplot.scatter) – Mr G Jun 10 '21 at 23:44
  • Can be abbreviated, e.g. `fc='none', ec='r'` – mins Nov 15 '22 at 16:58
98

Would these work?

plt.scatter(np.random.randn(100), np.random.randn(100), facecolors='none')

example image

or using plot()

plt.plot(np.random.randn(100), np.random.randn(100), 'o', mfc='none')

example image

endolith
  • 25,479
  • 34
  • 128
  • 192
Gökhan Sever
  • 8,004
  • 13
  • 36
  • 38
  • 5
    this is useful for when you use `plot` instead of `scatter` – Trevor Boyd Smith May 15 '18 at 19:16
  • 4
    For `scatter`, you need to specify `edgecolors` like `edgecolors='r'`. Otherwise, the circles disappear. [See here](https://matplotlib.org/api/_as_gen/matplotlib.pyplot.scatter.html) – T_T Jan 30 '19 at 05:47
  • 3
    @T_T If I specify `edgecolors='r'` I have to specify a color by hand. Is there a way to have the empty circles not disappear, but letting PyPlot choose automatic the colors for each series? – a06e Nov 21 '21 at 15:35
  • @becko No idea, sorry. – T_T Nov 22 '21 at 05:17
15

Here's another way: this adds a circle to the current axes, plot or image or whatever :

from matplotlib.patches import Circle  # $matplotlib/patches.py

def circle( xy, radius, color="lightsteelblue", facecolor="none", alpha=1, ax=None ):
    """ add a circle to ax= or current axes
    """
        # from .../pylab_examples/ellipse_demo.py
    e = Circle( xy=xy, radius=radius )
    if ax is None:
        ax = pl.gca()  # ax = subplot( 1,1,1 )
    ax.add_artist(e)
    e.set_clip_box(ax.bbox)
    e.set_edgecolor( color )
    e.set_facecolor( facecolor )  # "none" not None
    e.set_alpha( alpha )

alt text

(The circles in the picture get squashed to ellipses because imshow aspect="auto" ).

denis
  • 21,378
  • 10
  • 65
  • 88
6

In matplotlib 2.0 there is a parameter called fillstyle which allows better control on the way markers are filled. In my case I have used it with errorbars but it works for markers in general http://matplotlib.org/api/_as_gen/matplotlib.axes.Axes.errorbar.html

fillstyle accepts the following values: [‘full’ | ‘left’ | ‘right’ | ‘bottom’ | ‘top’ | ‘none’]

There are two important things to keep in mind when using fillstyle,

1) If mfc is set to any kind of value it will take priority, hence, if you did set fillstyle to 'none' it would not take effect. So avoid using mfc in conjuntion with fillstyle

2) You might want to control the marker edge width (using markeredgewidth or mew) because if the marker is relatively small and the edge width is thick, the markers will look like filled even though they are not.

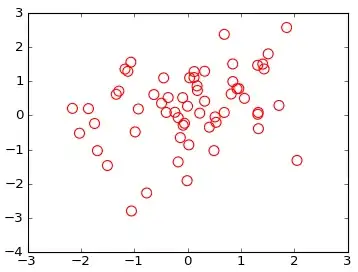
Following is an example using errorbars:

myplot.errorbar(x=myXval, y=myYval, yerr=myYerrVal, fmt='o', fillstyle='none', ecolor='blue',  mec='blue')
Salvatore Cosentino
  • 6,663
  • 6
  • 17
  • 25
  • 3
    Good tip re controlling of the line widths! The `markeredgewidth` parameter is called `linewidths` in **matplotlib 3.3.1**. See up-to-date information in the [documentation](https://matplotlib.org/api/pyplot_api.html#matplotlib.pyplot.scatter) – XavierStuvw Oct 21 '20 at 10:31
6

Basend on the example of Gary Kerr and as proposed here one may create empty circles related to specified values with following code:

import matplotlib.pyplot as plt 
import numpy as np 
from matplotlib.markers import MarkerStyle

x = np.random.randn(60) 
y = np.random.randn(60)
z = np.random.randn(60)

g=plt.scatter(x, y, s=80, c=z)
g.set_facecolor('none')
plt.colorbar()
plt.show()
Aroc
  • 1,022
  • 1
  • 10
  • 18
  • This is the essentially a complexified version the accepted answer… – Eric O. Lebigot Dec 02 '19 at 20:54
  • From my point is it not. Using scatter plot with colors does not except facecolor="none" within the command. Therefor the subsequent removement of the facecolor is needed as described in the given link. Unfortunaly this complexified solution is needed to remove the facecolor in scatter plots with colorcoding. – Aroc Dec 03 '19 at 10:41
  • The approach in this answer is indeed useful if one wants to update a graph that originally does not contain empty circles. However, the question about _creating_ these circles directly, so the accepted solution is the way to go, as it does the same as this answer but directly, with no extraneous update of a first graph. – Eric O. Lebigot Dec 04 '19 at 14:19
  • 1
    This "complexified version" worked for me when embedding the argument within `.scatter()` did not. For context, I was also applying a colormap (`c=z, cmap='jet'`). – fact_finder May 13 '20 at 23:53
  • 1
    this was the only answer that actually worked for empty circles with different colors – raphael Aug 11 '20 at 08:40
1

So I assume you want to highlight some points that fit a certain criteria. You can use Prelude's command to do a second scatter plot of the hightlighted points with an empty circle and a first call to plot all the points. Make sure the s paramter is sufficiently small for the larger empty circles to enclose the smaller filled ones.

The other option is to not use scatter and draw the patches individually using the circle/ellipse command. These are in matplotlib.patches, here is some sample code on how to draw circles rectangles etc.

whatnick
  • 5,400
  • 3
  • 19
  • 35