2

Is there a way to ignore outliers just for geom_smooth, not for whole chart? I am trying to show that Olympic Games are being held in bigger cities than they used to. To do so I made a chart:

Chart with outliers

But if I delete the outliers manually (2 observations - one for winter Olympics in Beijing in 2020 and The World Games in London), the chart looks like this:

Chart without outliers

The problem is that I want to include those points in the chart, but not for lm calculation. Also I want it to be easy to read for people without statistical backgrounds, so I do not want to use different smoothing methods ( I saw an answer for loess smoothing R: How to remove outliers from a smoother in ggplot2? but that does not help in this case.

My sample code is:

ggplot(dane, aes(x = year, y = City_Size, col = IO_Type )) +
  geom_jitter(size = 3) +    
  geom_smooth(method = lm,  se = F, linetype = "dotted")
Oli
  • 9,766
  • 5
  • 25
  • 46
AAAA
  • 461
  • 6
  • 22
  • Can you provide some data to reproduce your example? – F. Privé Jul 22 '17 at 12:54
  • 3
    You did it already. You have oner data set with everything and one with the outliers removed. use the `data` parameters to both `geom_jitter()` and `geom_smooth()` use each different data frame you made and don't include a main data param in the `ggplot()` call. – hrbrmstr Jul 22 '17 at 13:00
  • 1
    To add to @hrbrmstr answer - you must explicitly call the data argument `geom_jitter(data=withOutliers)` and `geom_smooth(data=withoutOutliers)`. You cannot drop the `data=` part. – CMichael Jul 22 '17 at 13:36

1 Answers1

1

Outliers in Plot

You have probably long since moved past this question, but I will provide an answer anyway if somebody may find it useful. Since data wasn't provided, I will use the iris dataset and run things in the tidyverse as an example of what you can do. First, I will load my libraries and add outliers to the variables Sepal.Length and Sepal.Width below. To check if its an outlier, you can also use the is_outlier function from rstatix:

#### Load Library ####
library(tidyverse)

#### Add Outliers and Inspect ####
iris[1,1] <- 20
iris[1,2] <- 20
iris %>% 
  head()
rstatix::is_outlier(iris$Sepal.Length)[1]

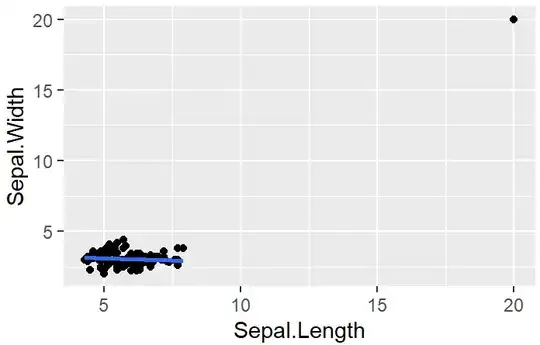
Next if we naively plot as is, it will look like this below:

#### Naive Plotting ####
iris %>% 
  ggplot(aes(x=Sepal.Length,
             y=Sepal.Width))+
  geom_point()+
  geom_smooth(method = "lm")

enter image description here

Ignoring Outliers for Regression Line

Now all we have to do is use a subset of the data, filtering for these two extreme values:

iris %>% 
  ggplot(aes(x=Sepal.Length,
             y=Sepal.Width))+
  geom_point()+
  geom_smooth(data=subset(iris,
                          Sepal.Length < 20,
                          Sepal.Width < 20),
              method = "lm")

Which now gives us the fit line we want:

enter image description here

It looks like you have colored regression lines and points by groups as well, which you can just as easily do here, though with the data so clustered in the corner its not helpful in this case:

iris %>% 
  ggplot(aes(x=Sepal.Length,
             y=Sepal.Width,
             color=Species))+
  geom_point()+
  geom_smooth(data=subset(iris,
                          Sepal.Length < 20,
                          Sepal.Width < 20),
              method = "lm")

enter image description here

Shawn Hemelstrand
  • 2,676
  • 4
  • 17
  • 30