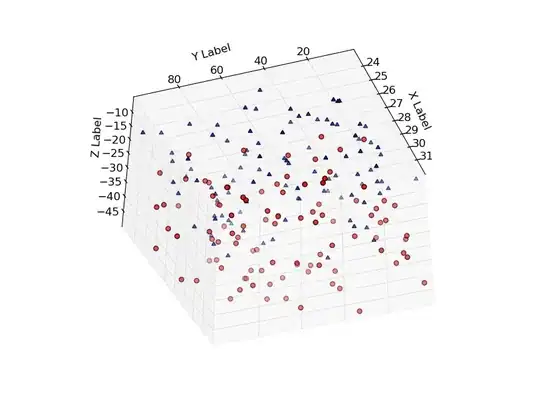
Currently I'm using matplotlib to plot a 3d scatter and while it gets the job done, I can't seem to find a way to rotate it to see my data better.
Here's an example:
import pylab as p
import mpl_toolkits.mplot3d.axes3d as p3

#data is an ndarray with the necessary data and colors is an ndarray with
#'b', 'g' and 'r' to paint each point according to its class

...

fig=p.figure()
ax = p3.Axes3D(fig)
ax.scatter(data[:,0], data[:,2], data[:,3], c=colors)
ax.set_xlabel('X')
ax.set_ylabel('Y')
ax.set_zlabel('Z')
fig.add_axes(ax)
p.show()
I'd like a solution that lets me do it during execution time but as long as I can rotate it and it's short/quick I'm fine with it.
Here's a comparison of the plots produced after applying a PCA to the iris dataset:
1. mayavi

2. matplotlib
Mayavi makes it easier to visualize the data, but MatPlotLib looks more professional. Matplotlib is also lighter.