43

How does one reorder series used to create a chart in Excel?

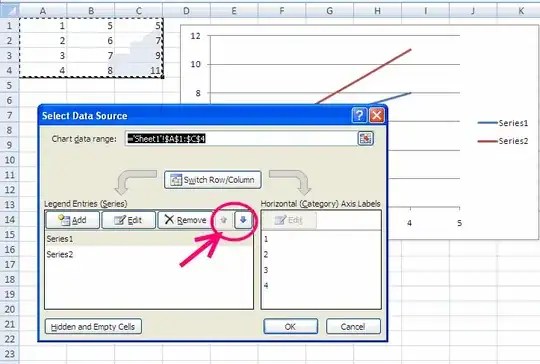
For example, I go to the chart, right click > Select Data. In the left column I see series 1, series 2, to series n.

Say, I want to move series 3 after series 4, can it be done from chart view? I don't want to move the data cells in the worksheet.

I'm using Excel 2011 (mac OS X).

M--
  • 25,431
  • 8
  • 61
  • 93
KM.
  • 1,382
  • 1
  • 19
  • 34
  • 1
    As you asked (before I edited it), the proper place for this type of question is Super User, since it doesn't involve code. – Lance Roberts Aug 08 '11 at 16:39
  • [How to sort data series in a legend of a chart using VBA?](https://stackoverflow.com/questions/43546534/how-to-sort-legend-of-a-chart-in-vba?noredirect=1&lq=1) – M-- Oct 11 '19 at 15:00

9 Answers9

69

Select a series and look in the formula bar. The last argument is the plot order of the series. You can edit this formula just like any other, right in the formula bar.

For example, select series 4, then change the 4 to a 3.

Jon Peltier
  • 5,895
  • 1
  • 27
  • 27
  • 1
    Nice! Except, if you have "n" series, you can't go to n+1; Excel keeps you at "n." My bar chart has pairs of columns with a space, and I can't add a space b/n the last two pairs of pairs using this, but this is awesome! Thank you! – KM. Mar 09 '11 at 16:27
  • @KM Add another series to the chart, do what you need, remove at the end. – M-- Jan 11 '19 at 07:08
39

Right-click any series on the chart. In the "Format Data Series" dialog, there is a "Series Order" tab, in which you can move series up and down. I find this much easier than fiddling with the last argument of the series formula.

This is in Excel 2003 in Windows. There is a similar dialog in Excel 2011 for Mac:

enter image description here

Jean-François Corbett
  • 37,420
  • 30
  • 139
  • 188
22

These are the buttons UP/DOWN

enter image description here

Dr. belisarius
  • 60,527
  • 15
  • 115
  • 190
  • 5
    Thank you. Unfortunately, they are missing from the Mac Version. Sigh. – KM. Mar 02 '11 at 14:54
  • 1
    This worked great in 2010 windows version. It is much better than trying to manipulate the formulas. In 2010 you can get to this by right clicking anywhere on the chart and selecting "Select Data." It's easy to do and easy to teach other people in the office. – Nigel Aug 07 '14 at 17:30
4

See below

Use the below code, If you are using excel 2007 or 2010 and want to reorder the legends only. Make sure mChartName matched with your chart name.

Sub ReverseOrderLegends()

mChartName = "Chart 1"
Dim sSeriesCollection As SeriesCollection
Dim mSeries As Series
With ActiveSheet
    .ChartObjects(mChartName).Chart.SetElement (msoElementLegendNone)
    .ChartObjects(mChartName).Chart.SetElement (msoElementLegendRight)
    Set sSeriesCollection = .ChartObjects(mChartName).Chart.SeriesCollection
    For Each mSeries In sSeriesCollection
        If mSeries.Values(1) = 0.000000123 Or mSeries.Values(1) = Empty Then
            mSeries.Delete
        End If
    Next mSeries

    LegendCount = .ChartObjects(mChartName).Chart.SeriesCollection.Count
    For mLegend = 1 To LegendCount
        .ChartObjects(mChartName).Chart.SeriesCollection.NewSeries
        .ChartObjects(mChartName).Chart.SeriesCollection(LegendCount + mLegend).Name = .ChartObjects(mChartName).Chart.SeriesCollection(LegendCount - mLegend + 1).Name
        .ChartObjects(mChartName).Chart.SeriesCollection(LegendCount + mLegend).Values = "={0.000000123}"
        .ChartObjects(mChartName).Chart.SeriesCollection(LegendCount + mLegend).Format.Fill.ForeColor.RGB = .ChartObjects(mChartName).Chart.SeriesCollection(LegendCount - mLegend + 1).Format.Fill.ForeColor.RGB
    Next mLegend

    For mLegend = 1 To LegendCount
        .ChartObjects(mChartName).Chart.Legend.LegendEntries(1).Delete
    Next mLegend
End With
End Sub
EdChum
  • 376,765
  • 198
  • 813
  • 562
Hakan
  • 49
  • 1
4

Excel 2010 - if you're looking to reorder the series on a pivot chart:

  • go to your underlying pivot table
  • right-click on one of the Column Labels for the series you're looking to adjust (Note: you need to click on one of the series headings (i.e. 'Saturday' or 'Sunday' in the example shown below) not the 'Column Labels' text itself)
  • in the pop-up menu, hover over 'Move' and then select an option from the resulting sub-menu to reposition the series variable.
  • your pivot chart will update itself accordingly

enter image description here

Jon295087
  • 731
  • 1
  • 8
  • 28
3

To change the stacking order for series in charts under Excel for Mac 2011:

  1. select the chart,
  2. select the series (easiest under Ribbon>Chart Layout>Current Selection),
  3. click Chart Layout>Format Selection or Menu>Format>Data Series …,
  4. on popup menu Format Data Series click Order, then click individual series and click Move Up or Move Down buttons to adjust the stacking order on the Axis for the subject series. This changes the order for the plot and for the legend, but may not change the order number in the Series formula.

I had a three series plot on the secondary axis, and the series I wanted on top was stuck on the bottom in defiance of the Move Up and Move Down buttons. It happened to be formatted as markers only. I inserted a line, and presto(!), I could change its order in the plot. Later I could remove the line and sometimes it could still be ordered, but sometimes not.

3

FYI, if you are using two y-axis, the order numbers will only make a difference within the set of series of that y-axis. I believe secondary -y-axis by default are on top of the primary. If you want the series in the primary axis to be on top, you'll need to make it secondary instead.

omikun
  • 273
  • 1
  • 2
  • 14
2

To change the sequence of a series in Excel 2010:

  • Select (click on) any data series and click the "Design" tab in the "Chart Tools" group.
  • Click "Select Data" in the "Data" group and in the pop-up window, highlight the series to be moved.
  • Click the up or down triangle at the top of the left hand box labeled "Legend Entries" (Series).
Asherah
  • 18,948
  • 5
  • 53
  • 72
Helper
  • 21
  • 1
1

This function gets the series names, puts them into an array, sorts the array and based on that defines the plotting order which will give the desired output.

Function Increasing_Legend_Sort(mychart As Chart)


    Dim Arr()
    ReDim Arr(1 To mychart.FullSeriesCollection.Count)

        'Assigning Series names to an array
        For i = LBound(Arr) To UBound(Arr)
        Arr(i) = mychart.FullSeriesCollection(i).Name
        Next i

        'Bubble-Sort (Sort the array in increasing order)
        For r1 = LBound(Arr) To UBound(Arr)
            rval = Arr(r1)
                For r2 = LBound(Arr) To UBound(Arr)
                    If Arr(r2) > rval Then 'Change ">" to "<" to make it decreasing
                        Arr(r1) = Arr(r2)
                        Arr(r2) = rval
                        rval = Arr(r1)
                    End If
                Next r2
        Next r1

    'Defining the PlotOrder
    For i = LBound(Arr) To UBound(Arr)
    mychart.FullSeriesCollection(Arr(i)).PlotOrder = i
    Next i

End Function
M--
  • 25,431
  • 8
  • 61
  • 93
  • https://stackoverflow.com/questions/43546534/how-to-sort-legend-of-a-chart-in-vba – M-- Jun 30 '17 at 20:41